Database Reference
In-Depth Information
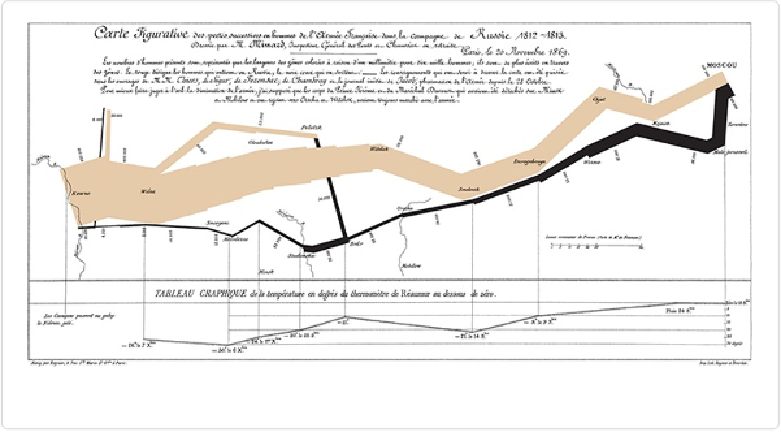
Figure 10-1. Minard's “carte figurative” of Napoleon's March of 1812
The thickness of the band represents the size of Napoleon's army, with the pale colored band
showing the French soldiers' advance on Moscow and the black band their return. The
gradual narrowing of the band conveys the staggering loss of life that occurred during the
campaign. The line plot at the bottom charts the temperature during the return.
What's most remarkable about this now-famous map is that it was created by a man who
wasn't a professional cartographer at all. Minard spent his career working on dams, canals,
bridges, and railroads, and his map was largely ignored by professional cartographers of his
day. Minard was an expert in the flow of masses across a terrain, and he applied his profes-
sional expertise to his hobby: history.
With a little effort using today's tools, anyone can become a hobbyist cartographer like
Minard. In this chapter, we're going to consider how to communicate positional data using
circle maps, filled maps (or choropleths), and maps that combine both of these approaches.
In later chapters, we'll consider different types of maps, including maps with shapes and
maps using custom imported background images.