Database Reference
In-Depth Information
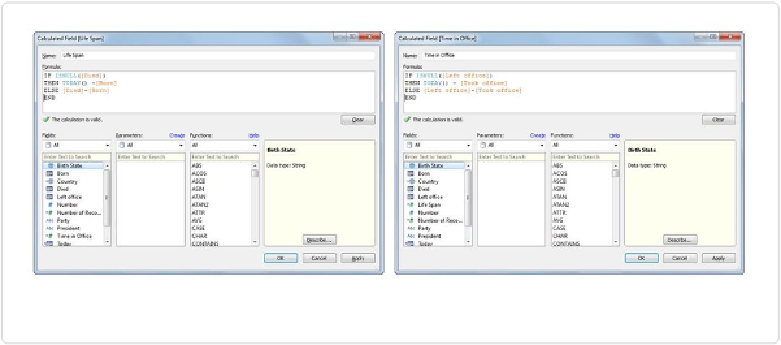
Figure 9-21. Calculating life span and time in office
Now that we've created these two fields, we can begin creating timelines using the Gantt Bar
option by following these steps:
1. Drag
Took Office
to the Columns shelf and change the pill to
Day, continuous
.
2. Change the Marks type from
Automatic
to
Gantt Bar
using the drop-down selector.
3. Drag
Time in Office
from the Measures pane to the Size shelf.
4. Drag
Party
from Dimensions to the Color shelf.
The resulting simple timeline is shown in
Figure 9-22
.