Database Reference
In-Depth Information
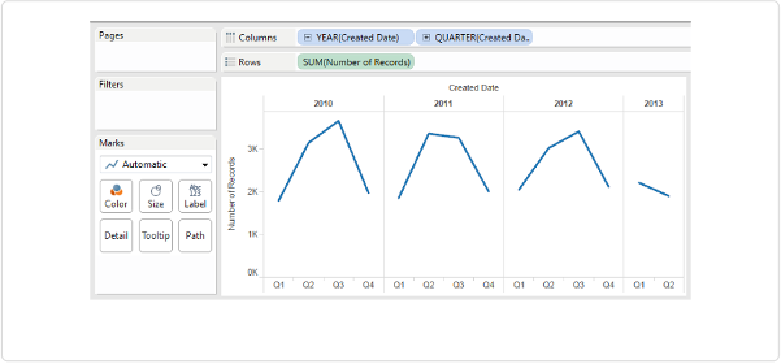
Figure 9-15. Rat sightings by quarter
Notice that
Year(Created Date)
now has a
-
sign next to it. Clicking on the
-
sign returns
down the data by month. By using the
+
and
-
symbols, we can either increase or decrease
the level of aggregation of the data.
We can also change the
Created Date
field from discrete to continuous by clicking the
down arrow in the
Year(Created Date)
pill and selecting either
Year
,
Month
,
Week Num-
ber
, or
Day
from the options below the line, resulting in the line charts shown in
Figure 9-16
(shown with the partial month of June 2013 excluded).