Database Reference
In-Depth Information
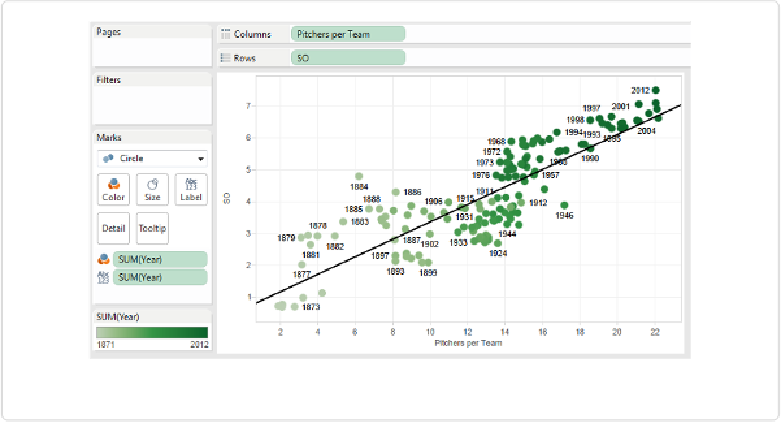
Figure 9-10. Basic scatterplot colored by year and year labels added
This helps somewhat: we can tell that the circles in the lower-left region correspond to the
earliest seasons and the circles in the upper right are more recent. Yet another way to show
the pattern is to connect the dots of successive years with a straight line. To do so, we'll need
to change the Marks type from
Circle
to
Line
, and move
SUM(Year)
from the Color shelf to
Path, resulting in the somewhat scrambled view shown in
Figure 9-11
.
From this view, we can see that the points start in the lower left and ricochet their way up-
ward and to the right, indicating an increase in both variables over the years. Depending on
the data, connected scatterplots are generally easier to read when we plot fewer points. Let's
filter the view to just the years in question: 1981 to the present. To do so, we can right-click
on
Years
in the Measures panel and select
Show Quick Filter
, entering
1981
into the left
parameter of the quick filter, as shown in
Figure 9-12
.