Database Reference
In-Depth Information
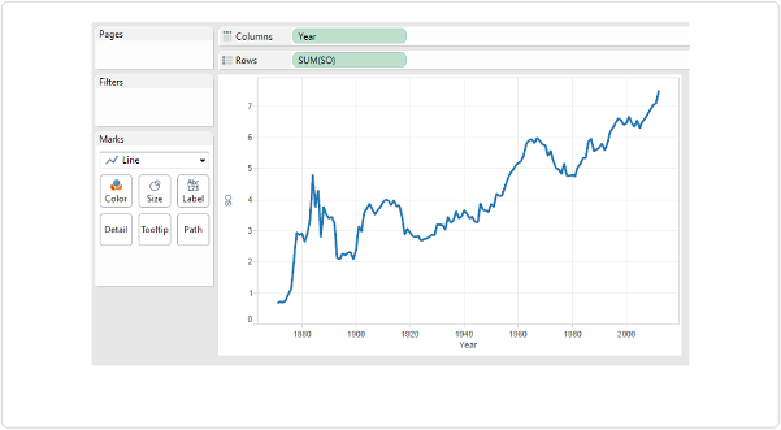
The resulting line chart is shown in
Figure 9-3
.
Figure 9-3. A simple line chart showing the increase
How would we describe this pattern? There is no doubt that there is an increasing trend in the
number of strikeouts per game over the past century and a half. The climb looks dramatic,
but if we add a trend line by right-clicking in the chart area and selecting
Trend Lines
, then
Show Trend Lines
, we can see that the average number of strikeouts per game has increased
at a glacial rate of 0.033 strikeouts per game each year, on average. So every decade, pitchers
struck out one extra batter every three games, on average. The time chart with added trend
line is shown in
Figure 9-4
.
There are a number of departures from the trend, though, aren't there? Before the turn of the
twentieth century, the rules of baseball were in a state of flux. For example, the definition of
the strike zone underwent a number of changes, and until 1887, batters could actually request
a high pitch or a low pitch. Correlated with these changes to the rules, we see a relatively
high degree of flux in the number of strikeouts per game until about 1920, when the rules of
the game stabilized. Strikeouts per game began steadily climbing, and then something
changed in the late 1960s.