Database Reference
In-Depth Information
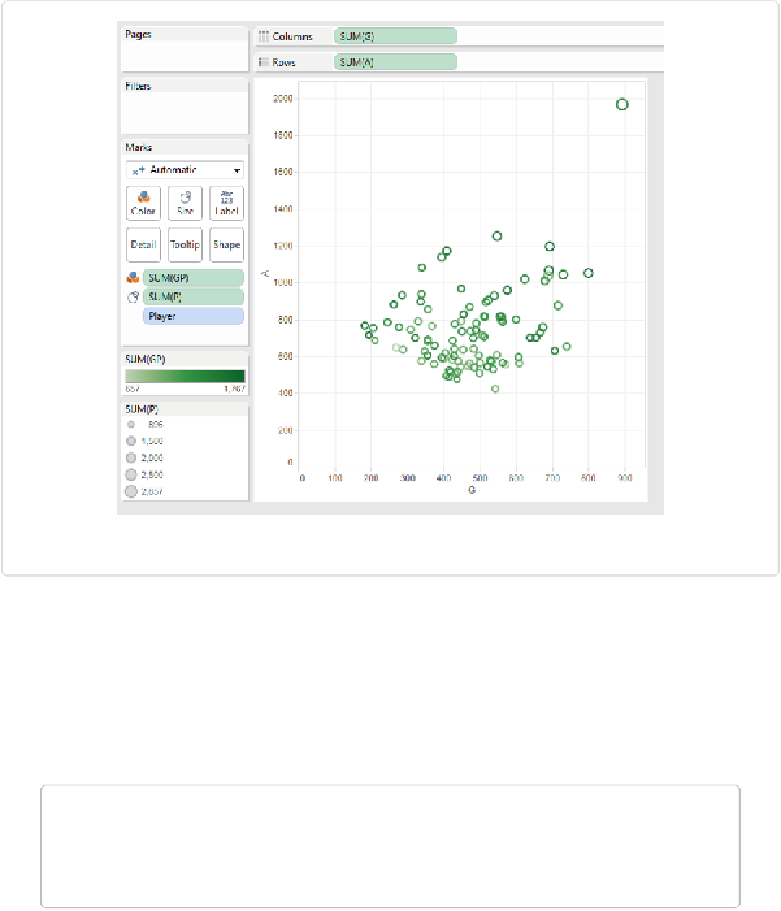
Figure 8-3. Scatterplot with added encodings for size and color
The larger the ring, the more career points a player has. The darker the ring, the more games
a player played. These new comparisons are based on area and color ramp encodings, re-
spectively. Refer back to
Figure 1-6
and notice that area and color ramp are below position in
the Quantitative list. The scatterplot still primarily facilites a comparison of the goals and as-
sists, which are encoded based on position.
NOTE
When deciding which variables to use where, consider which are the most important com-
parisons to make, and then encode them with the most effective encodings.