Database Reference
In-Depth Information
Figure 7-20. A binomial probability distribution for the chess club survey results
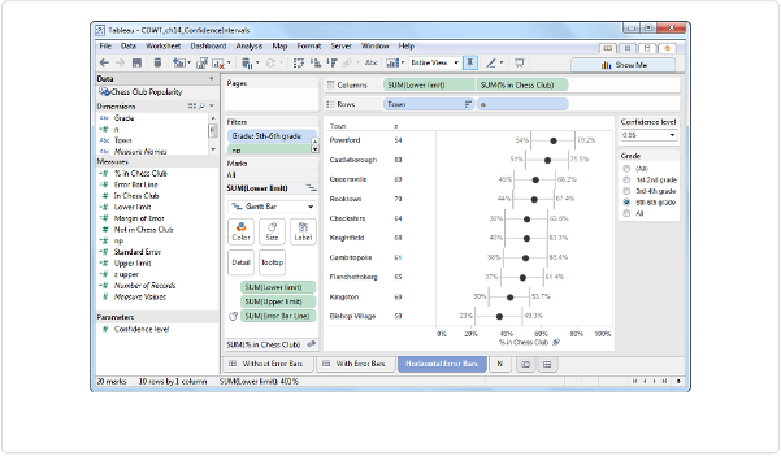
The confidence intervals are shown for each city and each grade in Figures
7-21
,
7-22
,
and
7-23
.
Previous Page
Next Page
Communicating Data with Tableau
Search WWH ::
Custom Search
Home