Database Reference
In-Depth Information
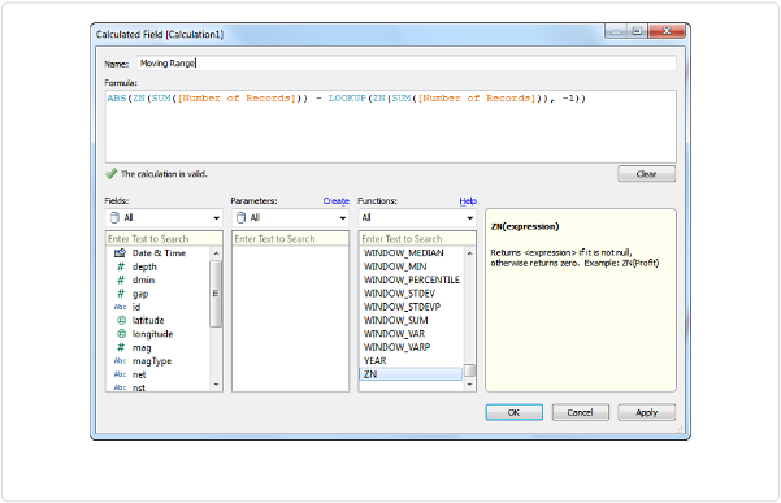
Figure 7-13. Modifying the Moving Range table calculation to make it an absolute value
Add the average lines for both the Individuals chart (top) and the Moving Range chart (bot-
tom) by right-clicking on each of the y-axes and selecting
Add Reference Line
, similar to
Step 2 in the quick method. Do this for both charts.
Create the following three calculated fields,
MR_UCL
,
UCL
, and
LCL
, which are Shewhart's ori-
ginal equations to determine the control limits:
MR_UCL = 3.267*WINDOW_AVG([Moving Range])
UCL = SUM([Number of Records]) + 3*WINDOW_AVG([Moving Range]) / 1.128
LCL = SUM([Number of Records]) - 3*WINDOW_AVG([Moving Range]) / 1.128
Figure 7-14
shows these equations in Calculated Field dialog boxes.