Database Reference
In-Depth Information
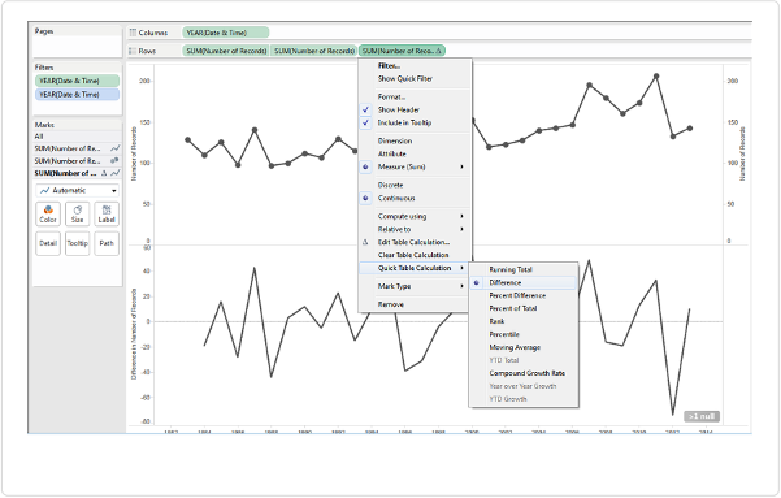
Figure 7-12. Adding a Moving Range chart
Edit the Table Calculation and click Customize to open the edit dialog, adding
ABS()
around
the entire equation, as shown in
Figure 7-13
. Also, make the new Moving Range chart a
dual-axis chart with a line and circle marks for the individual data points as we did with the
top chart.