Database Reference
In-Depth Information
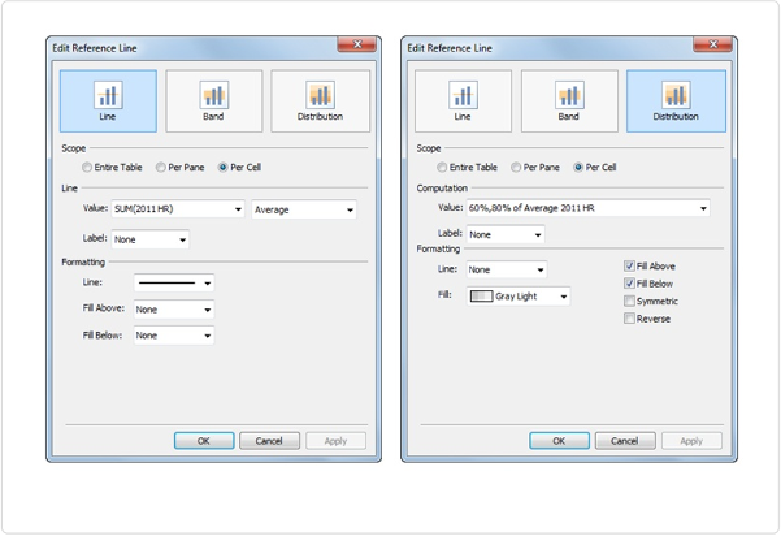
Figure 5-18. Two reference lines automatically created along with the bullet graph
Using this bullet graph, we can easily communicate a number of comparisons. It's clear that
New York hit the most home runs in the league in both the 2011 and 2012 seasons, and that
their 2012 tally was more than their 2011 tally. Similar questions can be answered about each
team. The bullet graph is a very efficient and effective tool for comparison.
Lastly, let's briefly consider actual-to-target comparisons.
Actual-to-Target
The world is full of people and teams with goals in the form of quotas, budgets, and perform-
ance targets. These figures are tracked and monitored religiously to determine “performance
to plan.” Just listen to any monthly sales call. You'll hear discussions about concepts such as:
▪ How are we doing compared to where we want to be at the end of the year?