Database Reference
In-Depth Information
Web.
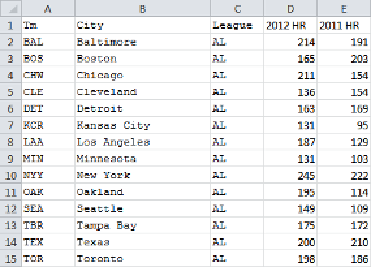
Figure 5-15
shows the complete table.
Figure 5-15. Team home run totals, 2011 and 2012
The Bullet Graph
One very efficient way to show each of these comparisons in one view is using a
“bullet
ing
City
,
2011 HR
, and
2012 HR
, and then choosing
bullet graph
from the Show Me panel.
The resulting view is shown in
Figure 5-16
.
In this initial view created from the
Show Me
menu, the length of the blue bars is determined
by the
2011 HR
totals, as evidenced by the green pill in the Columns shelf. The vertical black
lines are the
2012 HR
totals for each team, and the bands are at 60% and 80% of the 2012
values.


