Geology Reference
In-Depth Information
implying the possibility that AVO could be a useful
technique.
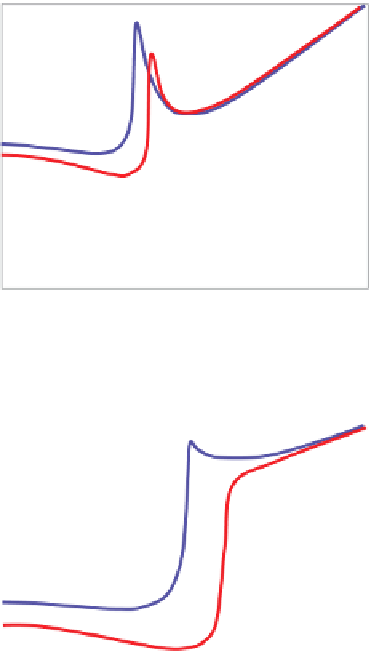
Figure 5.15
shows Chalk data with the same
porosities as the sands in
Fig. 5.14
.TheAVOplots
(
Figs. 5.15a
and (
b
)) show clear differential AVO
effects between brine and gas responses over angles
in the range 0
0.75
0.50
0.25
34% porosity
shallow sand
0.00
30°. However, it is evident from the
AVO crossplot (
Fig 5.15c
) that the magnitude of
the AVO difference at 34% porosity is much less
than for the sandstone with the same porosity
shown in
Fig. 5.14
. Interestingly, in this example,
the fluid AVO difference for the 18% porosity
chalk is greater than for the 18% porosity sand-
stone.
Figure 5.16
shows a model for the same shale
but now overlying a 20% porosity dolomite. The
fluid related differential AVO is now much less
-
-0.25
-0.50
18% porosity sand
-0.75
-0.75
-0.50
-0.25
0.00
0.25
0.50
0.75
Intercept
Figure 5.14
Model data illustrating that porosity is a significant
factor in the magnitude of an AVO anomaly. Note: blue
¼
shale/
brine sand, red
¼
shale/gas sand.
a)
1.0
0.8
0.6
Brine
0.4
0.2
Gas
c)
0
- 0.2
Shale on 18% porosity chalk
0.75
- 0.4
0.50
0
10 20
30 40
50
60
70
80
90
0.25
Angle of incidence
0.00
34% porosity chalk
b)
-0.25
1.0
18% porosity
chalk
-0.50
0.8
-0.75
-0.75
0.6
-0.50
-0.25
0.00
0.25
0.50
0.75
0.4
Intercept
0.2
0
- 0.2
Shale on 34% porosity chalk
- 0.4
0
10
20
30 40
50
60
70
80
90
Angle of incidence
68
Figure 5.15
AVO models of North Sea Chalks with different porosities: (a) shale overlying 18% porosity chalk with brine and gas, (b) shale
overlying 34% porosity chalk with brine and gas, (c) AVO crossplot showing data from pre-critical reflections in (a) and (b).