Geology Reference
In-Depth Information
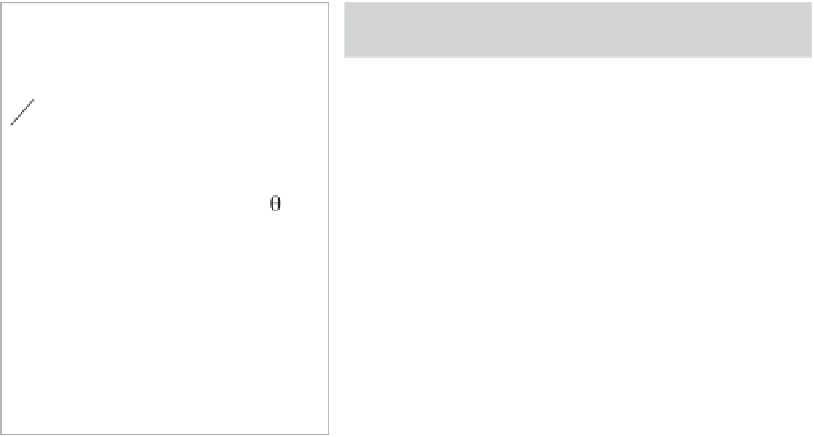
Absolute
Amplitudes
R(0) - Controlled by contrast
of acoustic impedance
across the boundary
+
Class
Gradient
Notes
AI
+ve R(0), may have
phase reversal
I
Far < R(0)
-
Class 1
+ve R(0), phase
reversal
IIp
-
Far > R(0)
Class 2p
(deg)
-
Low amplitude
at R(0)
20
II
Far > R(0)
10
30
Class 2
AI
Relatively high
amplitude at R(0)
Class 3
III
-
Far > R(0)
Class 4
Very high
amplitude at R(0)
IV
+
Far < R(0)
-
Figure 5.2
The AVO classes (modified after Rutherford and Williams,
1989
; Ross and Kinman,
1995
; Castagna and Swan,
1997
).
incidence reflection coefficient and overall decreasing
amplitude with offset.
As previously discussed in
Chapter 2
, the first
order control on the intercept is the acoustic imped-
ance contrast. On the other hand, the sign and mag-
nitude of the AVO gradient is determined principally
by the contrast of shear velocity across the boundary
(Castagna et al.,
1998
; Castagna and Smith,
1994
).
Negative gradients are associated with a positive shear
velocity contrast (i.e. lower shear velocity in the upper
layer) whilst positive gradients are associated with
negative shear velocity contrast (i.e. higher velocity
in the upper layer).
Given the origins of the AVO classes it could be
argued that they should only be applied to hydrocar-
bon sands. Clearly this is restrictive and most workers
tend to use the class definitions simply as descriptors
of AVO behaviour. The AVO classes are a useful
general description but in practice it is often necessary
to look at AVO plots from gathers to understand the
response in more detail.
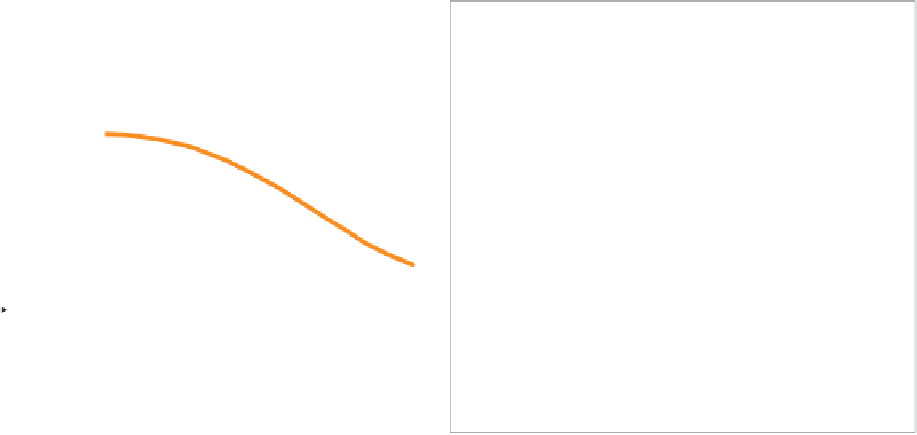
G
+
Class
IV
+
-
R(0)
Class
III
Class I
-
Class
II
Class
IIp
Figure 5.3
The AVO classes and the AVO crossplot.
et al.,
1993
; Castagna and Swan,
1997
; Sams,
1998
;
Smith
2003
).
Figure 5.3
illustrates how the various
AVO classes described above occupy different areas of
the plot. The AVO crossplot is an important tool for
understanding lithology and fluid discrimination and
this is discussed in more detail in
Section 5.5
and
Chapter 7
.
5.2.3 Introducing the AVO crossplot
Whilst the AVO plot shown in
Fig. 5.2
is a useful way
of visualising AVO responses it is generally of little
use in analysing the multitude of responses from
seismic data. These limitations are overcome by
plotting the intercept and gradient of each response
as a single point on an AVO crossplot (e.g. Foster
5.2.4 Examples of AVO responses
Figure 5.4
shows some real examples of the different
classes of AVO response. It should be noted that there
is nothing about these responses that allows us to
59