Geology Reference
In-Depth Information
a)
b)
0
24ms
twt
c)
d)
High amplitude
shales
Low amplitude
shales
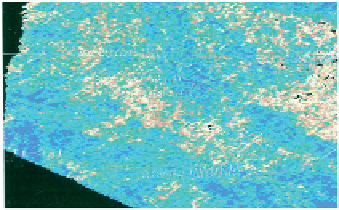
Figure 4.28
Which loop to pick? It can matter (after White and Simm,
2003
): (a) seismic section showing trough and peak picks, (b) the
seismic wavelet, (c) amplitude map of red trough (minimum value in short window around yellow horizon), (d) amplitude map of blue peak
(maximum value in short window around light blue horizon).
kurtosis. Early application of the maximum kurtosis
technique suffered from drawbacks such as bias
toward large reflections and instablility with poor
bandwidth data (e.g. van der Baan and Pham,
2008
).
However, with modern hi-fidelity data and advances
in algorithm design it has been shown that statistical
methods can give similar results to those obtained
from the well matching technique (Edgar and van
der Baan,
2011
). Whilst this is encouraging, it is
unclear how errors might be estimated in the absence
of wells (i.e. to determine the level of confidence in
the results). As yet, statistical methods are not rou-
tinely available in commercial software packages but
it is evident that they could prove useful for quality
control purposes.
reservoir are evident on the map generated from
the blue peak pick (
Fig. 4.28d
) but not on the map
of the red trough above (
Fig. 4.28c
). The red trough is
not simply a side lobe of the peak; it interferes with
the side lobe of the top of the sealing formation.
Accurate understanding of the wavelet shape is neces-
sary to make the correct interpretation.
4.6.5 Understanding offset scaling
A useful aspect of well matching techniques is that not
only is the likely wavelet shape identified but also the
scaling of the wavelet is calculated. If the amplitudes
of near and far stacks have been balanced correctly
(i.e. to be consistent with the amplitude variation in
the well-based angle synthetic), then wavelet extrac-
tions of each stack should give not only similar wave-
let shapes but also the same scaling.
Figure 4.29
shows
an example where a difference in scaling between near
and far stacks was identified through wavelet extrac-
tion. Prior to AVO analysis a scalar would be applied
to correct the balancing. Many inversion software
packages apply such corrections semi-automatically,
4.6.4 Importance of tie accuracy in
horizon mapping
Figure 4.28
shows an example where understanding
the polarity of the data is vital to identifying the loop
that carries the amplitude information about the top
reservoir. Lithological variations at the top of the
56