Geology Reference
In-Depth Information
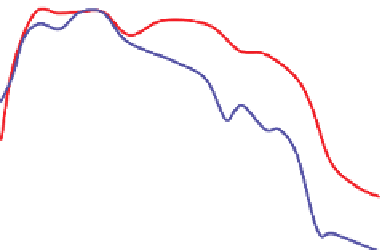
Wavelet from 1067m
3ms
0
50ms
10
20
3139m
dB
30
40
50
20
40
60
80
100
120
140
Frequency (Hz)
Figure 4.23
Two wavelets from different depths in a VSP, aligned on the first break.
AI Syn
Extracted
wavelet
AI
Syn
Regional
extracted wavelet
-100
-100
-50
-50
0
0
50
50
150
150
Amplitude
Amplitude
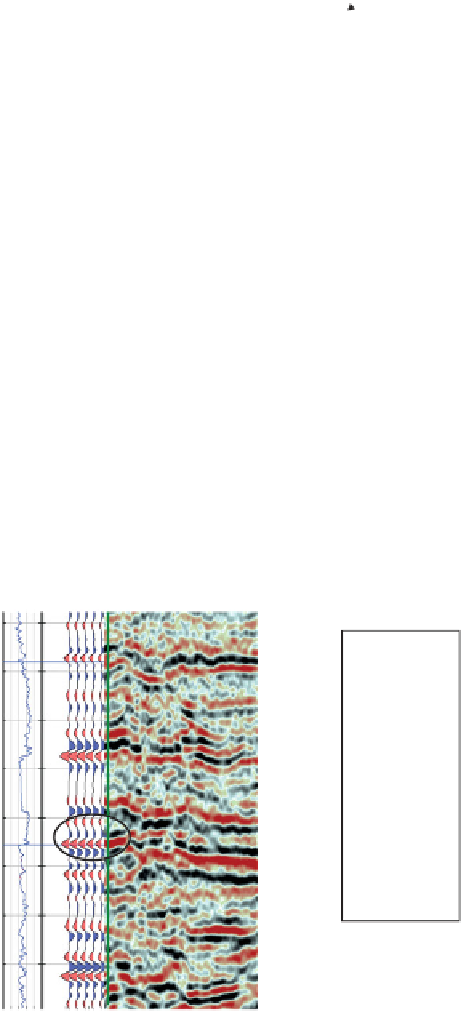
Figure 4.25
The same well tie as
Fig. 4.24
but with a trough-
dominated wavelet (seismic timing lines have 100 ms separation).
Figure 4.24
Visual well tie made with peak-dominated zero phase
wavelet (seismic timing lines have 100 ms separation).
In some circumstances distinctive geological fea-
tures might be used to infer the phase of the data
(
result of constant phase rotations (
Fig. 4.26
). At the
thin end of the wedge the zero phase and 30° phase
pictures show the expected trough/peak (red/blue)
signature of a low-impedance thin bed. This contrasts
with the 60° and 90° pictures that have a red/blue/red
according to Brown,
2004
). For
example, a gas sand wedge model, based on a well
log and added noise, shows a variety of signatures as a
'
zero phaseness
'
54