Geology Reference
In-Depth Information
a)
b)
c)
Well Z
Best
100
-50
-50
80
60
0
40
20
40
20
0
PEP (%)
Delay (ms)
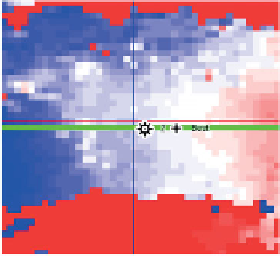
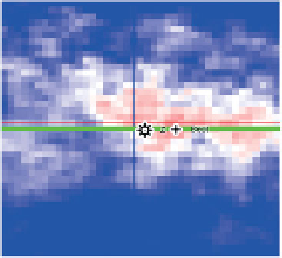
Figure 4.13
map (%), (b) seismic crossline (green line on maps) through well location and best match location,
(c) delay map (ms). Note that the distance between the well and the best match location is 110 m.
Well tie mapping; (a)
PEP
to examine the PEP and delay maps carefully. The
amount of lateral shift has to be reasonable, it should
be consistent when using different time windows for
the match, and the PEP map should show a distinct
area of maximum values.
(4) cross-correlate the synthetic trace with the seismic
trace and evaluate the shape of the cross-
correlation function,
(5) phase rotate the wavelet so that the cross
correlation function is symmetrical,
(6) apply a bulk shift or single stretch to correlate the
synthetic to the seismic,
(7) extract wavelet as a final QC step.
4.4.2 Adaptive technique
The well matching technique described above is
applicable in areas such as the North Sea where data
acquisition tends to be maximised and checkshot data
are regularly acquired. In cases where good check-
shots are not readily available, for example in areas
such as onshore Canada or in parts of the Gulf of
Mexico, the well tie process involves a little more trial
and error. Without checkshots the time
With this method it would be possible to scan for
the best match location but it is likely that the best
match would depend to some extent on the stretch
applied.
4.5 A well tie example
Both the well matching and adaptive techniques have
been applied to a North Sea dataset and the results
are shown in
Figs. 4.14
depth rela-
tion is based on the integrated sonic log sonic tied to
the two way time of a prominent seismic reflector.
The wavelet used in the synthetic is derived from the
amplitude spectrum of the data and an initial (zero)
phase assumption. There is usually a downward
stretch of the well synthetic required to tie the seismic.
In most cases a single stretch is all that is required.
Most software has an option to squeeze the synthetic,
although often there is no justification for doing this.
The effects of stretch and squeeze on the velocity log
should be carefully reviewed before proceeding. The
workflow, which is described here as an
-
the well tie using the extracted wavelet (from a
500 ms time segment). A time lag of +16 ms was
calculated in the wavelet estimation and this has been
applied to the wavelet to make the tie. It is a good tie
unambiguous phase of about
-
70° (using SEG posi-
tive standard polarity as the reference). It has been
extracted using the borehole deviation and ties to a
location 88m away from well location (
Fig. 4.14d
).
The shape of the cross-correlation confirms that the
wavelet estimation is good. Although this is a good
tie, at this point the interpreter should be wary of
associating the horizons on the logs with the seismic
trace (
Fig. 4.14a
) owing to the lag and phase rotation
of the wavelet.
'
adaptive
approach
'
is usually applied at the well location and
comprises:
(1) depth to time conversion (e.g. sonic integration),
(2) estimate the amplitude spectrum and derive the
zero phase equivalent wavelet,
(3) generate the synthetic,
47