Geology Reference
In-Depth Information
Geophone depth
300
400
500
600
Figure 4.4
Schematic geometry of VSP raypaths from a surface
source to borehole geophones. The separation of the source from
the borehole would in practice be very small for the case of a zero
offset VSP, but is here exaggerated for clarity.
700
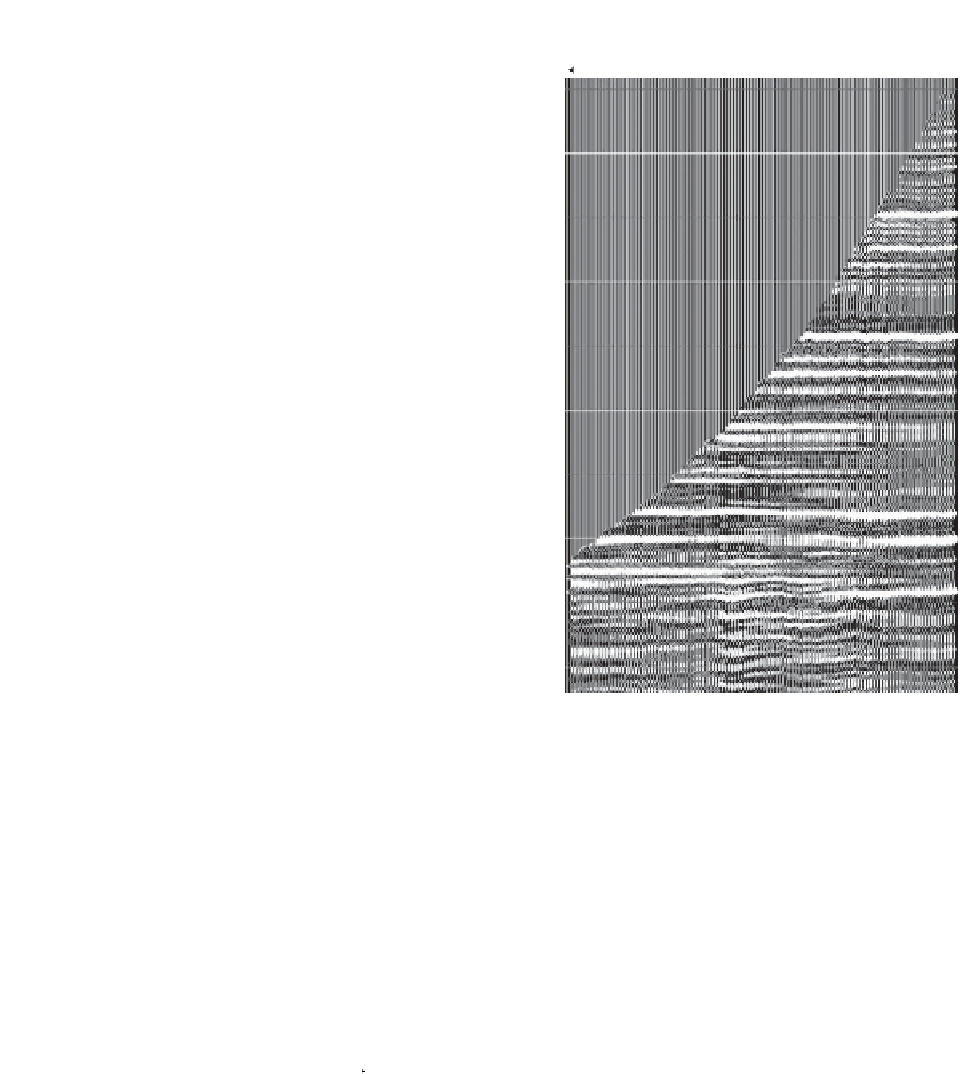
Figure 4.6
Example of VSP up-going wavefield after signal
enhancement (after Chopra
,
2004
; reprinted with permission of
the author and the CSEG Recorder).
et al.
Geophone depth
A schematic travel-time display for VSP data is
shown in
Fig. 4.5
. Key steps in the processing of VSP
data include the following.
(1) Measurement of the arrival time for the direct
wave arrival (energy onset or max/min of first
loop).
(2) Zero phasing operator design on the direct arrival.
(3) Determination of the down-going wavefield by
horizontal alignment of the data at the direct
arrival time followed by filtering to enhance
laterally continuous events.
(4) Estimation of up-going wavefield by subtraction
of downgoing wavefield from the data.
(5) Re-alignment of upgoing wavefield to position
reflections at their two-way times from surface
and enhancement by various processing methods
(
Fig. 4.6
).
(6) Generation of the corridor stack from the
processed upgoing wavefield. This involves
Direct arrival
Seabed
multiples
Reflected
arrivals
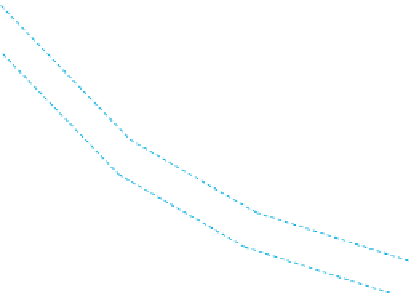
Figure 4.5
Schematic graph of VSP arrival time against geophone
depth for VSP data.
also present but these arrive after the direct wave and
single bounce up-going reflections. When the direct
arrival can be clearly defined it is possible to accur-
ately convert the direct arrival and the reflections that
immediately follow it to zero phase.
41