Geology Reference
In-Depth Information
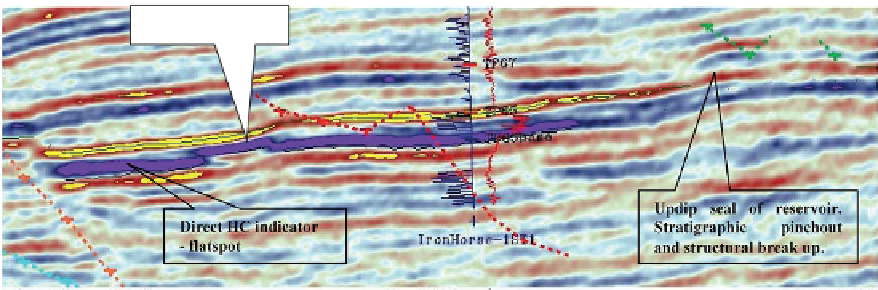
Figure 3.13
Example of spectral blueing; (a) before spectral blueing, (b) after spectral blueing (after Blache-Fraser and Neep,
2004
)
.
In this example the blueing has been targeted at enhancing the interpretability of the channel feature.
are boosted to match the maximum amplitude in the
original spectrum. A difficulty with this is the effect of
noise in real data. At frequencies where there is very
little signal, boosting the amplitude will simply increase
the noise content. In practice, therefore, tests need to be
run to find out what frequency range can be whitened
without making the trace data excessively noisy.
A more recent and more geophysically justifiable
approach is to design an operator to shape the reflect-
ivity spectrum of the seismic to match the spectrum
of reflectivity derived from well data. As shown by
tends to be blue with amplitude increasing with fre-
quency across the frequency range usually found in
seismic data. The slope of the amplitude
sometimes called spectral blueing. An example is
shown in
Fig. 3.13
, where blueing has enhanced the
resolution and facilitated the identification of a subtle
channel feature. As is sometimes the case, improved
definition of a target level has led to an increase in
noise elsewhere in the section. The scope for blueing
is thus still limited by the need to avoid undue
boosting of the noise content.
It may be useful to improve the signal to noise
ratio before bandwidth improvement, for example by
the application of particular types of filtering tech-
data should be divided into frequency bands and
filtering adapted to local dip (referred to as struture-
oriented filtering) is applied to each band separately,
followed by their recombination. In this way the filter
can be adapted to the noise level in each frequency
band. As can be seen from the example in
Fig. 3.14
,
after this noise reduction it is possible to apply quite
aggressive bandwidth improvement (in this case spec-
tral whitening) without introducing excessive noise.
frequency
relation varies from one depositional environment to
shown that the spectral decay of impedance as a
function of frequency is related to the fractal distribu-
tion of layer thickness in the Earth. Matching the
seismic spectrum to the well
-
31
spectrum is
thus