Geology Reference
In-Depth Information
Table 10.1
Reservoir and Seismic scorecard for assessment of
time lapse seismic feasibility (after Lumley et al.,
1997
)
1989-2008
2003-2006
2006-2008
80
80
80
Time-lapse feasibility scorecard
Ideal
60
60
60
40
40
40
RESERVOIR
Dry bulk modulus
20
20
20
5
Fluid compressibility contrast
5
Fluid saturation change
5
Porosity
5
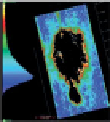
Figure 10.35
NRMS difference maps over Ekofisk, from
Predicted impedance change
5
Haugvaldstad
.(
2011
). The areas of large RMS difference in the
centre of the maps are genuine production-related effects
(Haugvaldstad
et al
Reservoir total
25
et al
.
2011
).
SEISMIC
Image quality
5
A good example of increasing repeatability of
marine surface seismic surveys over time has been
presented by Haugvaldstad et al., (
2011
)(
Figs. 10.34
and
10.35
). This concerns the Ekofisk Field in the
North Sea, over which five marine seismic surveys have
been acquired. The first survey was in 1989 (dual
source, dual streamer), the second in 1999 (two sources,
four streamers), and the third in 2003 (single source,
eight streamers). In 2006 a survey was shot with the
same configuration as in 2003, though with no attempt
to replicate the 2003 source and receiver locations.
Finally, a survey was shot in 2008 with steering of the
source and streamer employed in order to replicate the
2006 source and receiver locations as closely as pos-
sible, resulting inmuch greater consistency (
Fig. 10.34
).
NRMS difference between surveys in the area not
affected by production has evolved from 30%
Resolution
5
Fluid contacts
5
Repeatability
5
Seismic total
5
TOTAL SCORE
45
Source and reciver positioning difference
1989-2008
2003-2006
2006-2008
-
40%
for 1989
-
2008, through 20%
-
30% for 2003
-
2006 and
finally to 10%
2008 with duplication
of source and receiver positions (
Fig. 10.34
). In this
particular case, it was decided that six-monthly
monitor surveys would be appropriate for field man-
agement, and in 2010 a large array of permanent seabed
receivers was deployed, ensuring lower future acquisi-
tion costs and enhanced receiver repeatability.
Prior to a time-lapse project being sanctioned it
is usual for a feasibility study to be carried out.
A simple approach which can be used to rank as
well as to identify specific issues for individual fields
is the scorecard approach of Lumley et al.(
1997
).
Two scorecards are completed, a reservoir scorecard
which objectively identifies the relative magnitudes
of rock physics changes during production and a
more subjective seismic scorecard (
Tables 10.1
and
10.2
). Lumley et al.(
1997
) suggest that the reservoir
scorecard requires a
-
20% for 2006
-
S+ R (m)
0.10-50.00
50.01-100.00
100.01-5000.0
Figure 10.34
Computed at 1950m offset
Combined source and receiver positioning
difference maps for different pairs of surveys over Ekofisk, from
Haugvaldstad
et al
.(
2011
).
and time-variant amplitude envelope balancing,
matched filter corrections for amplitude, bandwidth,
phase and static shifts, residual migration and
residual time alignment (including static shifts and
warping) can then be more effectively used to
enhance the repeatability.
60% score for time-lapse to be
considered as a viable option. Given the advances in
seismic repeatability it is likely that this threshold is
>
246