Geology Reference
In-Depth Information
a)
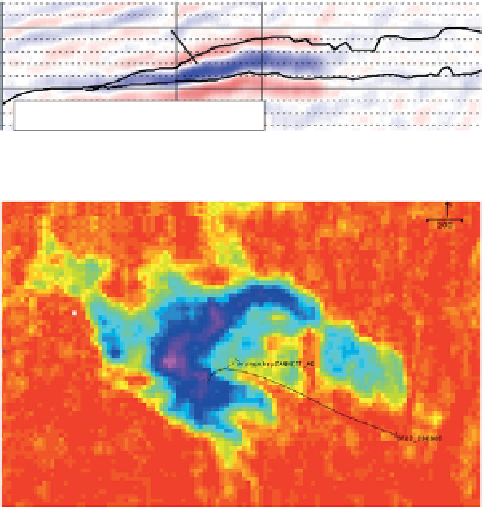
Figure 10.28
Time-lapse monitoring of
a water flood front (after Staples et al.,
2007
); (a) Quadrature difference section
(i.e. reflectivity difference phase rotated
by 90°) with blue loop effectively
representing impedance increase within
the reservoir (note that top reservoir and
original oil water contact picks have been
made on the baseline seismic survey), (b)
map of maximum quadrature difference
or impedance increase showing the form
of the flood front.
A A'
+
Aquifer flood
Top reservoir
OOWC
2000
2050
No aquifer flood
Quadrature difference 1993-2004
-
b)
A
Impedance
increase
Aquifer
Aquifer
No aquifer
flood
GF01
Aquifer
Infill well
GF02
No change
Aquifer flood
A'
Maximum impedance increase 1993-2004
example where a gas reservoir is flushed with water or
where gas is injected into an oil reservoir (
Fig. 10.27
).
Effectively, these patchy saturation effects might be
included in seismic modelling through the saturation
vs fluid modulus relationship (see
Chapter 8
). Factors
which appear to influence
It has also been observed that the Gassmann assump-
tion of the fluid independence of the shear modulus
may not be correct for carbonates (e.g. Japsen et al.,
2002
; Baechle et al.,
2003
). Both shear modulus
weakening and strengthening have been described
from laboratory experiments in carbonates.
Determining the appropriate seismic display for
highlighting these various changes in the reservoir
inevitably requires a consideration of AVO. The mag-
nitude of fluid related impedance change typically
increases with increasing incidence angle and far stacks
may provide a greater signal than full stacks (e.g. Boyd-
Gorst et al.,
2001
). Time-lapse changes will affect both
the amplitudes of reflections, owing to changes in
impedance, and the timing of seismic reflections,
owing to the change in velocity. In normally pressured
and consolidated reservoirs the dominant time-lapse
effect is on seismic amplitudes.
Figure 10.28
shows an
example of a relatively simple time-lapse signature
from the Gannet F field in the North Sea, related to a
water flood. The zone of water flooding is clearly seen
as a tuned signature on the time-lapse difference
section generated from two bandlimited impedance
volumes. Note that the top of the reservoir has been
picked on the baseline survey. Where the difference is
above tuning thickness (for example, to the right of the
of the fluid
distribution (Sengupta and Mavko,
2003
), are:
'
patchiness
'
permeability distribution,
relative permeability of the fluids,
irreducible saturations,
density contrasts of the fluid phases,
wettability of the rock,
fluid properties.
A usual assumption in time-lapse modelling is that the
mineral component of the rock is considered inert (i.e.
the fluid substitution process does not change the
nature of the dry rock frame). However, certain fluids
and minerals can be reactive. For example, Vanorio
et al.(
2008
,
2011
) describe changes in the dry rock
frame related to carbon dioxide injection. In brine-
saturated sandstones the dry rock frame can be stif-
fened due to the precipitation of salts at grain contacts
and in small pore throats, whereas in carbonates the
dry rock frame might be softened by the dissolution of
micro-crystalline matrix by carbon dioxide rich water.
242