Geology Reference
In-Depth Information
adequate well control. Critically, the variograms control
the vertical variance and lateral continuity of the
impedance realisations. High-frequency information
in the realisations is constrained principally by the
vertical variogram, with the low frequencies deter-
mined by the mean and standard deviation within each
layer. Typically it is straightforward to derive vertical
variograms from well logs, but there are usually not
enough wells to determine the lateral variogram accur-
ately. Inmany cases use is made of amplitude or imped-
ance maps (e.g. a slice parallel to top reservoir on
reflectivity or coloured impedance data) from which
the lateral dimensions of stratigraphic features are
inferred. Geological analogue information can also be
used to define the lateral variogram. Careful consider-
ation and sensitivity analysis is required. It should be
remembered that the lateral variogram has a significant
impact on any connectivity interpretation based on the
simulation results. Usually the variations of impedance
are not identical in every direction so anisotropies must
be taken into account.
Figure 9.33
illustrates examples
of vertical and lateral variograms.
Impedance traces are selected on the basis of sat-
isfying an objective function. Various goodness of fit
a)
b)
73º
0
-1000
1000m
0
30ms
0
c)
d)
73º
1
73º
163º
163º
0
0
500
1000m
0
1800
3600m
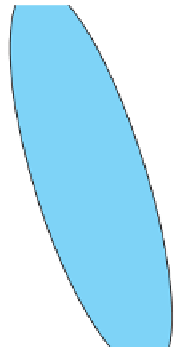
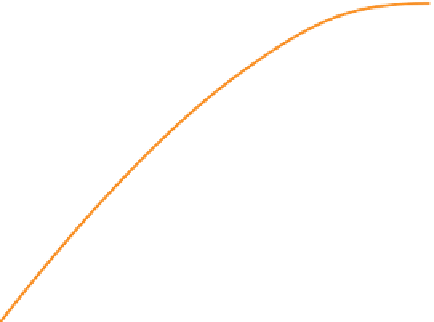
Figure 9.33
Variograms for input to a stochastic inversion; (a) Vertical variogram from well impedances, (b) lateral scale determined
from seismic amplitude map with anisotropy, (c) horizontal variogram for the main axes of anisotropy identified in (b), (d) final lateral
variogram (from Haas and Dubrule,
1994
).
218