Geology Reference
In-Depth Information
distribution, such as brine in the soft (crack-like)
pores and gas in the stiff (equi-dimensional) pores.
Given the variability of tight sands, rock physics
models need to be established on an individual
case basis. There are numerous issues in the character-
isation of these reservoirs, not least the petrophysical
challenges of estimating parameters such as porosity,
permeability and water saturation (e.g. Miller and
Shanley,
2010
). In addition, it is possible that anisot-
ropy due to a preferred alignment of microcracks may
be an issue to consider (Smith et al.,
2009
).
wet laminated
sand
2.4
shale
gas laminated
sand
2.3
2.2
wet sand
2.1
gas sand
2.0
0.04
8.6 Rock characterisation and
modelling issues
'
0.05
0.06
0.07
0.08
0.09
Compliance (1/M)(GPa)
effectively describes the
process of bringing together rock physics and petro-
physics observations within a geological context.
Some workers use the term
Rock
characterisation
'
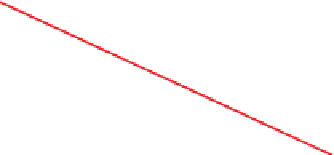
Figure 8.62
Fluid substitution in a laminated interval with 50%
V
sh
using Katahara
M
or P wave modulus) and density values are linearly scaled between
shale and gas sand end members. Red and blue lines are locally
determined trends for shale and brine sands respectively.
'
s(
2004
) technique. The compliance (inverse of the
to describe
the process of identifying rock types (e.g. friable vs
cemented sands) on the basis of elastic behaviour
in the context of rock physics theory and physical
measurements (e.g. Avseth et al.,
1998
,
2005
). To
summarise the various elements, rock characterisa-
tion comprises:
'
diagnosing
'
indurated reservoirs comprising shaley, silty uncon-
solidated sands or clean cemented sandstones with
low permeability (less than 0.1 md) and porosity
(generally less than 10%). These reservoirs present a
significant rock physics challenge. They are charac-
terised by a complex network of primary and sec-
ondary porosity with varying levels of connectivity.
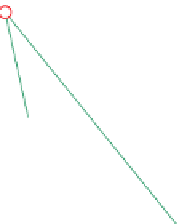
Smith et al.(
2009
) have described how variations in
velocity of tight sands are in large part controlled by
variable pore geometries and the presence of micro-
cracks (
Fig. 8.63
). This effectively means that vel-
ocity or seismic amplitude may be relatively poor
attributes for predicting porosity. It also means that
simple Gassmann fluid substitution is likely to be
inappropriate.
Fluid substitution in tight sands needs to be
addressed by using rock physics models in which pore
shape and the interaction of different pore shapes can
be specified. Thus, models such as the Xu
identification of rock types on porosity vs
velocity/ moduli crossplots using wet and dry
data,
fitting rock physics models,
definition of litho-facies,
fluid substitution,
derivation of depth (effective pressure) trends,
generation of depth and depositional environment
specific rock physics templates.
As described in this chapter, the construction of a
rock physics database requires considerable attention
to detail. Below are some key issues that the inter-
preter should consider in the use of such as database.
Identifying rock types from log data requires that
due consideration is given to the key factors that
can influence elastic behaviour such as mineral
composition, pore geometry, shale content,
cement volume and pore pressure (as described in
Chapter 5
). All geological information needs to be
included.
White
model (see
Section 8.2.7
) or the self-consistent model
of Berryman (
1995
) are appropriate. For example,
Ruiz and Cheng (
2010
) show modelling results in
which gas within microcracks reduces acoustic
impedance significantly, giving a much larger effect
than using Gassmann fluid substitution. This result
assumes that the gas and brine phases are mixed at
the finest scale, throughout the pore volume; a differ-
ent result would be obtained for a different fluid
-
It is not appropriate to perform fluid substitution
on averaged data. Fluid substitution should be
undertaken prior to averaging.
196