Geology Reference
In-Depth Information
5
3
2.5
4.5
Patchy saturation
Value of e
1
2
3
5
10
Woods
Law
2
4
1.5
3.5
1
3
0.5
Kw=2.7, Kg=0.05
Homogenous saturation
0
0
2.5
0.2
0.4
0.6
0.8
1
S
w
2
1
0
0.2
0.4
0.6
0.8
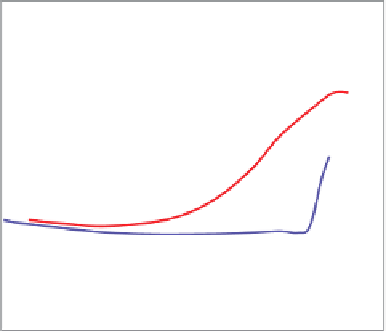
Figure 8.55
Fluid modulus estimation using the method
described by Brie et al.(
1995
). See text for discussion. (Copyright
1995, SPE. Reproduced with permission of SPE. Further reproduction
prohibited without permission.)
S
w
Figure 8.54
Effect of pore scale saturations on ultrasonic velocity
(modified after Knight and Nolen-Hoeksema,
1990
).
average and then mix this composite with the gas
using a stiffer mixing rule (M. Kemper, personal
communication).
Once the density, saturation components and end
member fluids have been addressed, Gassmann can be
implemented. One approach to evaluating whether
the sonic needs correcting is to compare dry rock
parameter outputs from the following scenarios.
(1) Assuming no invasion effect on sonic: input
corrected density, V
p
, V
s
, S
w
, and fluid mixing
using the Reuss average.
(2) Assuming invasion effect on sonic: input
measured density, V
p
, V
s
, S
x
, and fluid mixing
using the Reuss average.
'
'
saturations (on the scale of the logging wave-
length) can occur in invaded zones.
Patchy saturation effects can be accommodated in
Gassmann
patchy
s equation by adjusting the fluid stiffness
through various modes of fluid mixing. Fluid moduli
inversions of various log datasets (using a generalised
dry rock model) led Brie et al.(
1995
) to formulate a
relationship (
Fig. 8.55
) that effectively stiffens the
fluid modulus at low gas saturations:
'
S
x
e
+K
g
,
K
fl1
¼
K
w
K
g
ð
8
:
46
Þ
where K
fl1
¼
fluid modulus, K
w
¼
bulk modulus of
brine, K
g
¼
bulk modulus of gas, S
x
¼
invaded zone
saturation, e
¼
a number from 1 to 10 (and usually
around 2
5).
Other workers favour a Voigt average and the
Voigt
-
If these approaches do not yield reasonable results
then it could be that the Reuss mixing model is
inappropriate at logging frequencies and stiffer
mixing models are required.
In most situations the workflow will be iterative.
For example, where there is a hydrocarbon contact,
the dry rock properties above and below the contact
should be compared. They should be similar, unless
diagenesis has proceeded differently in the hydro-
carbon and water legs. If diagenesis differences are
significant then they would be manifested as a poros-
ity change at the contact.
Experience has shown that confident invasion cor-
rections can be made in practice only in clean sands
with good quality V
p
, V
s
, and density data and
-
Reuss
-
Hill average to model the patchy satur-
ation effect.
If water-bearing sands have been drilled with a
water-based mud, it is unlikely that the difference
between mud filtrate and formation water properties
will be significant and invasion corrections on the
sonic log may not be warranted. However, in flushed
gas sands and oil sands drilled with water-based mud
or water sands drilled with oil-based mud the possi-
bility of invasion must be considered. In the case of
oil based mud filtrate invading a gas zone, the effect-
ive elastic properties of a mixture of water, gas and oil
filtrate must carry some uncertainty. One approach
might be to mix the oil and water using the Reuss
'
evidence of the porosity of the sand (such as core
'
hard
190