Geology Reference
In-Depth Information
a)
b)
50
50
40
40
30
30
Clean sand trend
20
20
10
10
0
0
0
0
0.1
0.2
0.3
0.4
0.5
0.1
0.2
0.3
0.4
0.5
Porosity
Porosity
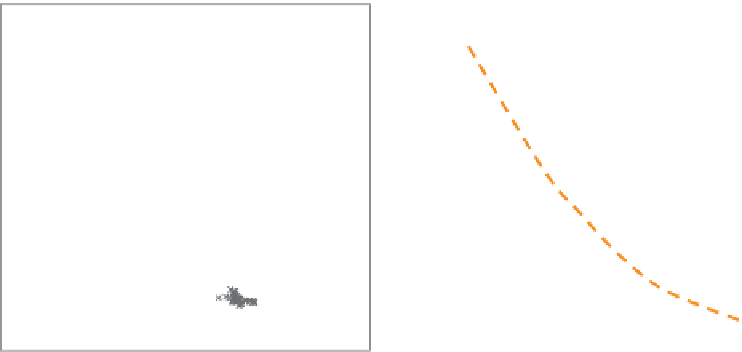
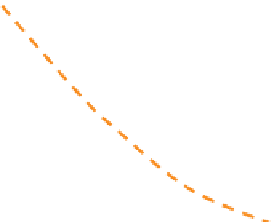
Figure 8.32
. Functions have
been derived (dashed orange curves) based on fitting the clean high-porosity data to the mineral point. For more discussion on the
interpretation of the data scatter see
Section 8.5.
Dry rock parameters inverted from log data using Gasmmann
'
s equation; (a) porosity vs
K
d
, (b) porosity vs
μ
change in porosity be? This is not a trivial question,
essentially requiring a calibrated rock physics model
to describe the porosity changes.
For small porosity changes a reasonable approach
is to assume that the pore space modulus K
are very small although these need to be taken into
account with rocks such as chalks that show signifi-
cant volume changes during production (MacBeth,
2004
). Dry rock moduli can vary significantly
with changing effective pressure but unfortunately
there are no simple guiding principles to help the
interpreter.
The increase of velocity or dry bulk modulus with
increasing effective pressure typically has an exponen-
tial profile (as shown in
Chapter 5
), with an initial
high rate of change, followed by a more gradual
change as the rock compressibility becomes less sen-
sitive to effective pressure. MacBeth (
2004
) has shown
that the variation of dry rock properties with effective
pressure, as measured on core samples in the labora-
tory, is not simply dependent on a parameter such as
porosity. Different sandstones show widely different
characteristics (
Fig. 8.33
), related to variations in rock
fabric and consolidation history. Given the lack of
definitive rock physics relations to guide the model-
ling of effective pressure and dry rock properties, time
lapse feasibility modelling requires laboratory meas-
urements of core velocities at different effective pres-
sures, or at least a good field analogue.
Several authors have published models that can be
used to fit laboratory data and guide modelling stud-
ies. MacBeth (
2004
) presented relations in terms of
the dry rock bulk modulus and the shear modulus:
and dry
ϕ
rock Poisson
σ
d
remain unchanged. Given
these two constraints the new dry rock bulk and shear
moduli for a change in porosity are given by
Eqs.
for porosity changes in clean sand of up to about 10
porosity units (i.e. percentage points). Modelling
changes greater than this requires an understanding
of how the rock fabric changes with porosity. One
approach for monomineralic rocks is to make use
of trends for the moduli against porosity generated
from Gassmann inversion to dry rock parameters
(
Fig. 8.32
). Modelling porosity effects related to
changing shale or clay content will require a specific
rock physics model, such as Raymer
'
s ratio
Hunt (
Section
8.2.2
) or inclusion type models (
Section 8.2.7
).
-
8.2.5.4 Dry rock pressure sensitivity
The sensitivity of reservoirs to changing stress is a
critical factor in understanding reservoir performance
through seismic monitoring. The effect of pore pres-
sure on the fluid is easily calculated, for example
through the equations of Batzle and Wang (
1992
).
In clastics porosity reduction or density variations
173