Geology Reference
In-Depth Information
a)
b)
40
40
30
30
20
20
10
10
0
0
0
0.1
0.2
0.3
0.4
0
0.1
0.2
0.3
0.4
Porosity
Porosity
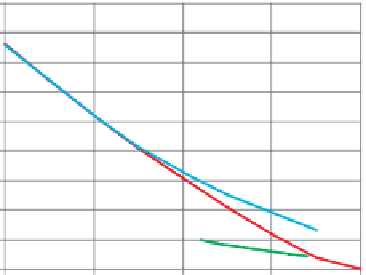
Figure 8.27
Examples of dry rock measurements in sandstones; (a) porosity vs dry rock bulk modulus, (b) porosity vs shear modulus. Purple
points
-
data from Han
et al
.(
1986
), dark blue points
-
Tertiary sandstone dataset from North Sea, red line
-
functions derived by Murphy
et al
.
2
) and
2
), blue line
(
1993
) for clean sandstone:
K
d
¼
38.18 (1
3.39
+ 1.95
μ ¼
42.65(1
3.48
+ 2.19
-
generalised trend for Tertiary
ϕ
ϕ
ϕ
ϕ
sandstones in the North Sea, green line
-
Troll data at an effective pressure of 5MPa (Dvorkin and Nur,
1996
), red points
-
selected
unconsolidated sand data.
8.2.5.1 Dry rock characteristics of sandstones
and carbonates
Typical values of dry rock parameters for sandstones
are shown in
Fig. 8.27
. The plot looks similar to the
porosity vs V
p
crossplot for brine-saturated data in
Fig. 8.4
, with a variety of trends related to variations
in rock stiffness and porosity reduction mechanisms.
It is typical that for low porosity sandstones (i.e.
below ~15%) the shear modulus is slightly higher or
of similar magnitude to the dry bulk modulus. At
higher porosities the dry bulk modulus is usually
higher than the shear modulus.
An example of a normalised bulk modulus plot
for dry rocks based on selected laboratory data from
sandstones is shown in
Fig. 8.28
. The sorting and
diagenesis trends are evident but it is also clear that
K
associated with increased clay content (
Figs. 8.28
,
and
8.29
).
An example of dry rock parameters for carbonates
is shown in
Fig. 8.30
. It is typical that the bulk modu-
lus is higher than the shear modulus across all poros-
ities owing to a dominant effect of the mineral
moduli. It is also characteristic that the dry rock
Poisson
s ratio shows a large scatter as a function of
porosity. Whilst much progress has been made in
linking velocity and moduli to pore geometry factors
in carbonates (e.g. Weger et al.,
2009
; Verwer et al.,
2010
), the interpretation of velocity ratios in carbon-
ates is as yet not fully explained (R. Weger, personal
communication).
'
8.2.5.2 Dry rock model for shear velocity prediction
An alternative approach to the empirical regression
methodology for shear velocity prediction described
in
section 8.2.2.4
is
/ K
0
values are greater than 0.06 for porosities less
than 32%. A combination of the dry bulk modulus
and shear modulus defines another parameter which
is useful
ϕ
'
the dry rock Poisson
'
s ratio
'
or
in Gassmann QC, namely the dry rock
'
approach (Gregory,
1977
; Pickett,
1963
). This method essentially uses Gassmann
Gregory
-
Pickett
'
'
Poisson
'
s ratio (
σ
d
):
s equa-
tion to predict shear velocity with one of the key
inputs being the dry rock Poisson
3K
d
2
μ
'
s ratio. The method
first calculates the dry bulk modulus from V
p
, density
(
σ
¼
+6K
d
:
ð
8
:
34
Þ
d
2
μ
), fluid and mineral moduli (K
fl
and
K
0
) and dry rock Poisson
ρ
), porosity (
ϕ
Typical values of dry rock Poisson
s ratio tend
to be between 0.1 and 0.3 for consolidated sandstones
(e.g. Spencer et al.,
1994
) with higher values generally
'
'
s ratio (
σ
d
):
170
K
d
¼
ð
1
y
Þ
K
0
,