Geology Reference
In-Depth Information
7000
5000
6000
2500
5000
0
0
2500
5000
7500
10000
4000
V
p
(m/s)
3000
Lms
Anhydrite
Dolomite
Chalk
Castagna Lms
Castagna Dolomite
2000
6000
Figure 8.12
An example of V
p
-V
s
trends in carbonates (data from
Rafavich et al.(
1984
) and Chalk data from the North Sea).
8000
10000
12000
V
p
(ft/s)
acquiring sonic logs in large boreholes) the
relationship for the velocity ratio may be
uncertain.
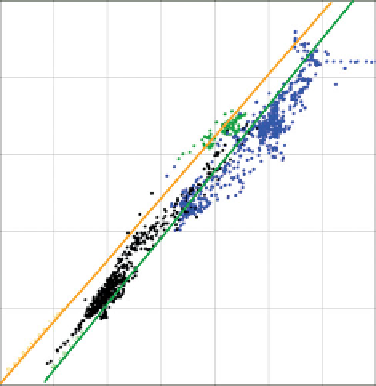
Figure 8.10
V
p
-V
s
crossplot from a North Sea oil field, showing
significant differences between log data and the empirical trends of
Castagna
et al
.(
1985
). Green points
-
oil sands, blue points
-
brine
sands and black points - shale.
Organic shales may have fairly low V
p
/V
s
ratios
(e.g Vernik and Milovac,
2011
), plotting above the
sandline in a similar region to hydrocarbon
bearing sands (
Fig. 8.11
). For example, Bailey and
Dutton (
2012
) present a V
p
-
V
sh
3000
1
V
s
relation for the
Kimmeridge Clay formation in the Central
North Sea:
'lean'
shale
0.9
0.8
2500
0.7
V
s
¼
0
:
75V
p
0
:
5625
:
0.6
Figure 8.12
illustrates variability in the V
p
/V
s
behav-
iour of selected carbonate data. Data presented for
limestones, anhydrite and dolomite from Oklahoma
by Rafavich et al.(
1984
) are consistent with Castag-
na
2000
0.5
0.4
Organic rich
'Hot' shale
0.3
1500
0.2
1.8) whereas
the data from some North Sea Chalks shows a
variation between Castagna
'
s dolomite trend (roughly V
p
/V
s
¼
Shale
Sand
0.1
'
s limestone and dolo-
0
100
2000
3000
4000
5000
6000
mite trends.
Owing to the variability in the relationships of V
p
and V
s
for different lithologies it is imperative for
shear log data (and possibly laboratory measurements
on core samples) to be acquired. Empirical V
p
-
V
p
(m/s)
Figure 8.11
V
p
-V
s
crossplot showing data from organic shales
plotting above the sandstone empirical trend of Castagna
et al
.
V
s
relations can also have other uses, such as providing
V
p
/V
s
constraints in elastic inversion (
Chapter 9
) and
also in log analysis. Williams (
1990
) describes a log
attribute called the
(
1985
).
significantly higher than that predicted by
Castagna
s sandline. As a rule of thumb this can
apply to sands where the compressional velocity is
less than about 2300 m/s. Unfortunately, owing to
the general lack of appropriate measurements in
this setting (for example due to the difficulty of
'
'
acoustic hydrocarbon indicator
log
which is applied to sandstone data and essentially
reveals the deviation of the logged V
p
/V
s
curve away
from the Castagna brine-saturated trends (
Fig. 8 13
).
The workflow Williams (
1990
) describes is as follows.
'
157