Geology Reference
In-Depth Information
7000
6000
Predominant pore type
Microporosity
Interparticle/crystalline prorosity
Density cemented
Moldic porosity
Intraframe porosity
5000
4000
3000
2000
1000
0
10
20
30
40
50
60
Porosity (%)
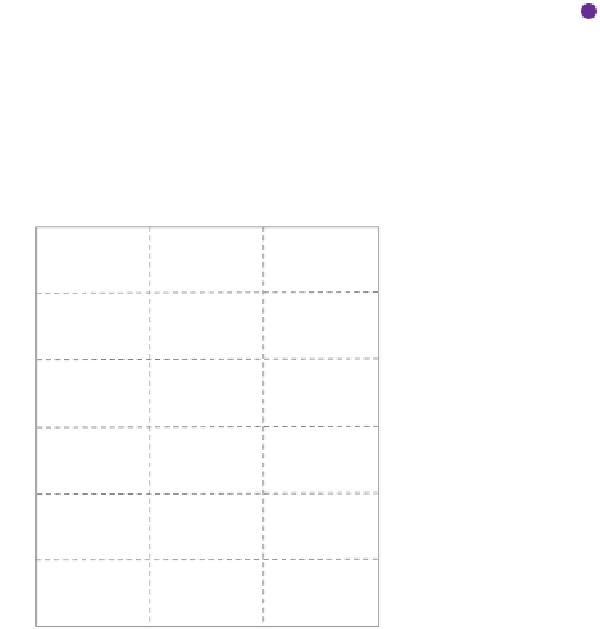
Figure 8.5
Crossplot of velocity (at 8 MPa effective pressure) versus porosity of various pore types of (brine filled) carbonates with an
exponential best fit curve through the data for reference (re-drawn after Eberli
et al
.,
2003
).
Following the work of Raymer et al.(
1980
), Raiga-
Clemenceau et al.(
1988
) provided an improvement in
the prediction of porosity from sonic by including
lithology-specific dependence:
Raymer-Hunt Model
14
0
1
x
t
0
t
12
ϕ
¼
1
,
ð
8
:
9
Þ
V
cl
where t
0
¼
sonic slowness and x
is a constant dependent on lithology.
Common values for matrix slowness and the fit-
ting coefficient
matrix slowness, t
¼
Shaley Sand
10
Sand
are shown in
Table 8.2
.
Interestingly, this sonic transform is based on the
formulation:
'
x
'
1
8
Sandy Shale
Shale
6
t
t
0
¼
Þ
x
,
ð
1
ϕ
ð
8
:
10
Þ
4
which is of a similar form to the relationship of
resistivity and porosity (Archie,
1942
):
R
R
w
¼
0
10
20
30
Total Porosity (%)
ϕ
m
a
¼
F
ð
8
:
11
Þ
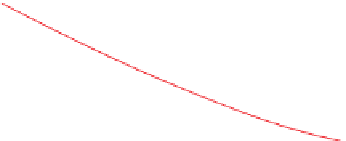
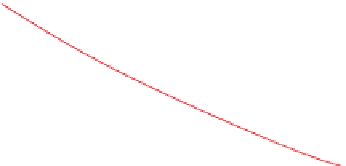
Figure 8.6
Use of the Raymer-Hunt empirical model to describe
changes in porosity and clay content (Dvorkin et al.,
2004
).
where
R
¼
true formation resistivity,
where
is the fractional porosity and V, V
0
and V
fl
are the velocities of the rock, the mineral matrix and
the fluid.
The Raymer
ϕ
¼
m
cementation component (see
Table 8.3
for
typical values),
a
constant, sometimes referred to as the
tortuosity factor,
F
¼
Gardner model is a flexible
model that can be readily calibrated to measured data.
An example of the application of the model in
describing dispersed shale in fluvial sandstones is
shown in
Fig. 8.6
. Of course the application of a
model in this way requires accurate estimates of min-
eralogy fractions and porosity.
-
Hunt
-
formation factor.
The relationship of sonic and resistivity measure-
ments is discussed in
Section 8.2.2.5.
Spikes and Dvorkin (
2005
) have noted that the
Wyllie time average equation is not consistent with
¼
154