Geology Reference
In-Depth Information
18
a)
b)
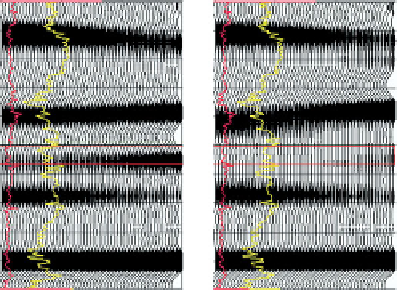
Gas
Brine
offset
offset
1.70
16
Wyllies equation
1.72
14
1.72
12
1.76
10
1.78
8
1.80
6
GR V
p
/V
s
Impedance of shale
overlying top chalk
GR V
p
/V
s
Figure 7.33
Model gathers showing fluid substitution effect in
dolomite (14%-20% porosity) encased in tight limestone, based
on data from the Western Canada sedimentary basin (after Li et al.,
2003
).
4
Top chalk = hard Top chalk = soft
2
0
10
20
30
40
50
Porosity %
limestone sequences in platform carbonate settings
(e.g. Li et al.,
2003
; Eissa et al.,
2003
). A key ampli-
tude diagnostic for recognising porous dolomite
with gas may be the strong positive AVO associated
with the base of the dolomite (
Fig. 7.33
), although it
is possible that large variations in porosity of brine
bearing dolomite will give rise to ambiguity in the
fluid interpretation. The presence of gas in fractures
can have a beneficial effect on detection, lowering
the Poisson
Figure 7.32
Relationship between porosity and acoustic
impedance in East Hod Field (after Campbell and Gravdal,
1995
).
In terms of seismic data quality, high velocities
in carbonates generally mean that seismic
resolution is low. In addition, carbonates are
commonly encountered on land or in shallow
water, and characterised by relatively poor data.
s ratio and accentuating the AVO effect
(e.g. Harvey,
1993
). AVO crossplot techniques
might be effectively used to discriminate dolomites
and tight limestones (
Fig. 7.34
).
The
'
Typical amplitude interpretation scenarios in
carbonate environments are associated with the
developmentofporo tyetheratthetopof
the carbonate section or in zones, owing to carbon-
ate facies variations or differences in diagenesis.
Figure 7.30
illustrates a dim spot on a full stack
seismic section associated with increased porosity at
the top of a North Sea chalk sequence. Dramatic
changes in porosity give rise to phase reversals
(
Fig. 7.31
). Similar phase reversal effects have also
been described in reef carbonate settings (e.g.
Chacko,
1989
). The strong relationship between
porosity and acoustic impedance (
Fig. 7.32
shows
an example) has been the basis for using seismic
inversion techniques in carbonates (
Fig. 7.31
and
Chapter 9
).
Amplitudes and AVO analysis may also help
in the detection of porous dolomite within tight
method of Chiburis (
1987
,
1993
)(
Chapter 5
) is also appropriate for analysing the
sub-parallel reflectivity of carbonate platform
sequences and it is possible to use the technique for
recognising hydrocarbon bearing zones (
Fig. 7.35
).
The technique comprises the following steps.
(1) Extract amplitudes on gathers (or partial angle
stacks) at target and reference picks.
(2) Calculate the normalised ratio (NR):
NR
'
relative AVO
'
(T/T
avg
)/(R/R
avg
),
where T
¼
¼
target amplitude, T
avg
¼
target
average amplitude, R
¼
reference amplitude and
reference average amplitude.
(3) Constrain range of values such that if NR
R
avg
¼
>
1 then
146
¼
NR_edit
2
(1/NR).