Geology Reference
In-Depth Information
a)
b)
0.9
1
1.1
A
I
=
1.2
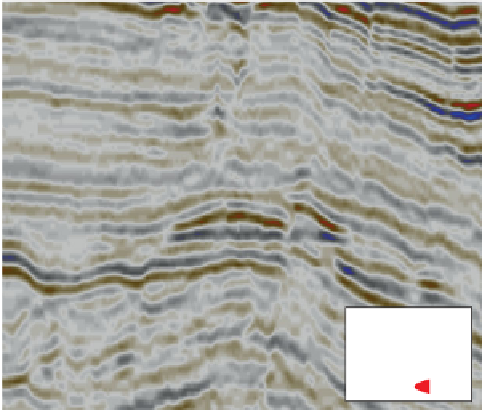
Figure 7.22
(a) Hydrocarbon flat spot (~1070 ms) showing (b) consistency of RMS amplitude with structure (polarity: black ¼ downward
increase in impedance) (courtesy WesternGeco).
a)
b)
Hydrodynamic
flow direction
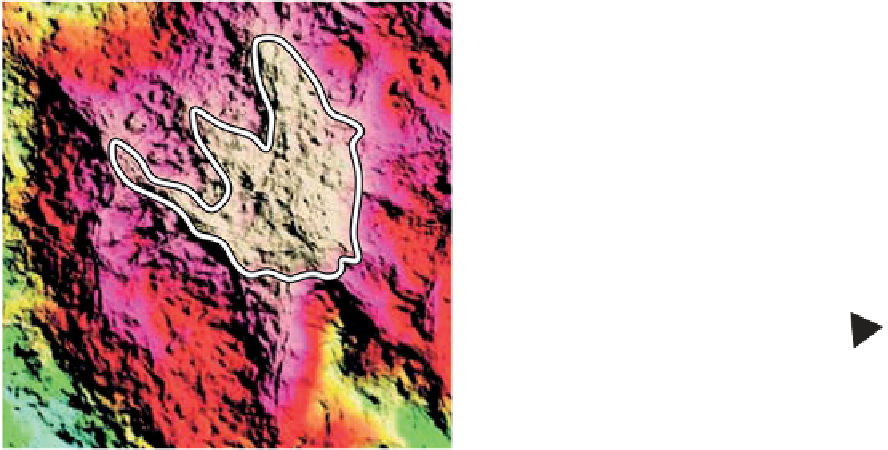
Figure 7.23
Structure, seismic amplitude and a tilted contact; (a) 3D-shaded structural relief map with the dip-closure outlined in white;
(b) bandlimited impedance extracted close to the top reservoir (red colours indicate relatively low impedance related to oil fill in channelized
sandstones oriented NW
SE). Note that the amplitude outline is shifted north-westwards from the structural closure owing to the effect of a
hydrodynamic gradient (modified after Dennis
-
141
et al.
,
2005
).