Geology Reference
In-Depth Information
AI
V
sh
Phi/S
w
PR
Gas
Wet
Incidence angle
Incidence angle
1
0
0
0.4 0
2 0
0.5
0º
40º
0º
40º
A
I
=
Figure 7.19
Modelled synthetic gathers from a sandstone reservoir with variable porosity layering. The hydrocarbon diagnostic is simply the
brightening of the reflectivity associated with the contrasts in porosity. Note timing lines have 20 ms separation.
1250
AI
1500
=
1750
1 km
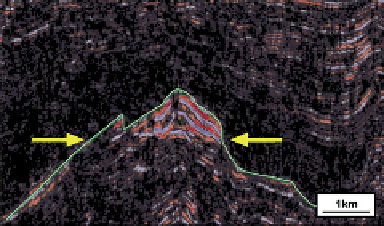
Figure 7.21
Troll gas field flat spot related to a gas water contact
(positive standard polarity with black representing a peak). Note also
the change in reflectivity at the top of the fault block (dimming of
black peak) as well as the apparent change in dominant frequency
beneath the flat spot.
Figure 7.20
Enhancing the hydrocarbon effect in thin bedded
reservoirs using optical stacking (after Cliff et al.,
2004
). In optical
stacking opacity is adjusted to highlight the bright amplitudes then
several adjacent sections are summed (in this case four sections are
summed).
140