Geology Reference
In-Depth Information
a)
b)
WATER SAND
GATHER
GAS SAND
GATHER
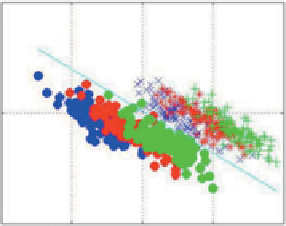
Horizon crossplot - red pick
Water sand
response
dominated
by noise
offset
offset
Red arrow
marks
decreasing
thickness of
gas pay zone
1200
1300
1400m
Figure 5.77
Seismic noise and AVO; (a) migrated stack and gather displays from a bright spot gas sand and correlative water sand. Good
signal-to-noise associated with the gas sand and noisy data from the low amplitude water sand. (b) AVO crossplot. Note how the noise prone
water sand data forms a high angle 'noise ellipse'
(modified after Simm et al.
2000
).
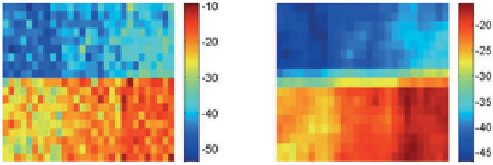
b)
Fluid projection
Raw data
Spatial smoothing
a)
Model AVO crossplot
Oil
0.5
Wet
Fluid discrimination trend
WET
Inc porosity
0
c)
OIL
Lithology projection
Spatial smoothing
Raw data
Lithology discrimination trend
-0.5
-0.2
-0.15
-0.1
-0.05
0
Oil
Intercept
Wet
Inc porosity
Figure 5.78
AVO model showing effect of random noise on fluid and lithology projections; (a) intercept vs gradient crossplot, (b) and (c)
pseudo-maps generated from the model clusters. Note that a 3 × 3 filter has been applied for the spatial smoothing (Roy White, personal
communication).
110