Geology Reference
In-Depth Information
a)
b)
c)
0.8
0.5
5
4.5
0.4
0.4
27º
4
0.3
0
3.5
0.2
3
-0.4
0.1
2.5
-0.8
0
2
AI
AI
R(0)
d)
e)
f)
0.8
0.5
5
11º
4.5
0.4
0.4
4
0.3
0
3.5
0.2
3
-0.4
0.1
2.5
-0.8
0
2
R(0)
AI
AI
g)
h)
30
30
20
20
10
10
-0.4
-0.2
0
0.2
-0.4
-0.2
0
0.2
Projection
Projection
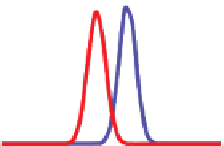
Figure 5.76
Model showing the effect of noise on intercept and gradient - blue points represent shale/brine sand reflections, red
points represent shale/oil sand reflections; (a-c) ¼ noise free model data (three single interface models representing different porosities
and fluid fill), (d-f) ¼ noise added to the models; (g) and (h) are projections at χ ¼ 27° and χ ¼ 11° respectively from the noisy data (data
from Roy White, personal communication).
109


