Geology Reference
In-Depth Information
AMPLITUDE
SPECTRUM OF
AI LOGS
Figure 5.74
Coloured inversion.
SEISMIC DATA
CI OPERATOR
Mean response
f
∝
Frequency
Log Frequency
Frequency
Bandlimited
Impedance
Time Series
Phase =-90º
The coloured
inversion operator is
that which maps the
mean response of
the seismic to a
curve of form f
∝
on parts of the general thickness trend of the gas
sand.
Random noise potentially has a different impact
on fluid versus lithology projections. The model data
in
Fig. 5.78
are similar to those shown in
Fig. 5.76
with three porosities and two fluid fills. Two projec-
tions are defined and the data clusters are arranged to
give a pseudo-map display. The noise has little
adverse effect in identifying a boundary (i.e. hydro-
carbon contact) on the fluid projection, largely
because the noise and signal are in similar directions.
It is clear, however, that lithology projections at high
angles to the noise trend are very noisy. Note that
spatial smoothing (e.g. 3 × 3 point average smoothing
operator) can be used to good effect to reduce the
effect of the noise on the maps. The beauty of ampli-
tude map displays is that they can contain significant
amounts of noise whilst still revealing geological lin-
eaments (
Section 3.8
).
χ
=3º
χ
=25º
χ
=90º
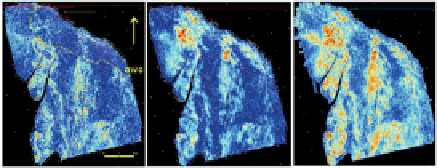
Figure 5.75
Average coloured inversion impedance maps from
offshore Angola (from Connolly et al.,
2002
).
sand gathers are dominated by random noise and
the extension in the gradient direction is an indica-
tion of the large amount of noise in the data. The
gas sand data have much higher signal to noise ratio
(S:N) and show a trend that is related to the
decreasing thickness of the pay zone. With the eye
of faith the noise trend can be seen superimposed
108