Geology Reference
In-Depth Information
correlated (i.e. if the gradient becomes more nega-
tive the intercept will become (slightly) more posi-
tive) (Hendrickson,
1999
;Simmet al.,
2000
). The
angleofthenoisetrendontheAVOcrossplotis
dependentontherangeofanglesusedinthe
parameter estimation and the greater the noise in
the data, the greater is the extension of data in the
gradient direction (Hendrickson,
1999
). The sup-
pression of noise is a critical aspect of any AVO
processing workflow and this is discussed in more
detail in
Chapter 6
.
An important effect of random noise is to rotate
the optimum fluid angle. Thus, the fluid angle
derived from seismic is usually lower than that
derived from well based models.
Figure 5.76
shows
modeldataforaboundarycomprisingshaleon
sand with three different porosities and with water
fill (blue) and hydrocarbon (red). The optimum
fluid (
a)
A
A'
A'
100ms
Reflectivity
b)
A
A'
A'
100ms
) angle in the data with no random noise is
27° (
Fig. 5.76a
), whereas in the model containing a
fairly typical level of random noise the angle is 11°
(
Fig. 5.76d
).
Figure 5.76
illustrates the effect of
projecting the noise prone data for each of these
angles. There is less discrimination when the theor-
etical angle is used. Finding the optimum fluid
angle in seismic data thus requires some trial and
error.
Figure 5.76
also illustrates how noise might propa-
gate into the derivation of elastic properties through
seismic inversion (SI). AI and SI have been inverted
from the reflectivity data in
Fig. 5.76d
(using equa-
tions described in
Section 9.2.7.3
) and AI vs PR and
AI vs SI plots have been generated (
Figs. 5.76e
,
f
). On
the AI vs PR plot it is clear that the effect of noise is to
broaden the range of values but also to introduce a
high angle trend. The shear estimation is determined
effectively from the gradient; thus noise in the gradi-
ent is propagated into the Poisson
χ
c)
2km
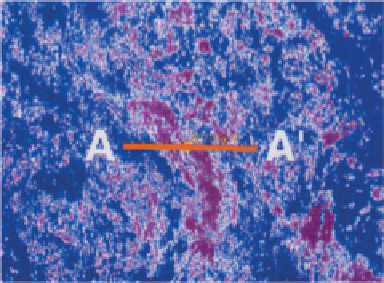
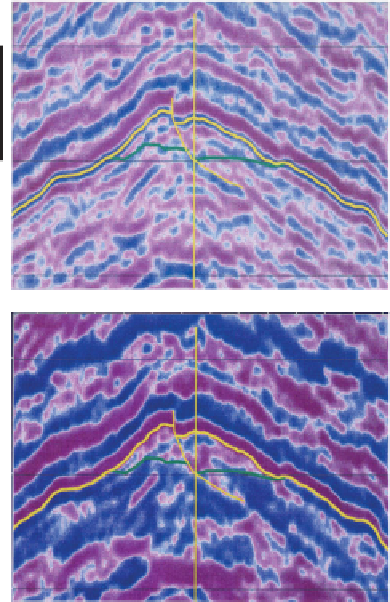
Figure 5.73
An example of bandlimited impedance (the SAIL
attribute); (a) reflectivity section with top reservoir in yellow,
(b) SAIL (bandlimited impedance) attribute, (c) slice through SAIL
volume 10ms below top reservoir. Red ¼ low impedance, blue ¼
high impedance.
s ratio parameter.
In the AI vs SI domain the noise trend is roughly
aligned with the porosity trend. These results point to
the need for noise attenuating data conditioning prior
to simultaneous
'
inversion for
absolute
elastic
parameters.
Figure 5.77
shows a seismic example of the effect
of random noise. The crossplot shows data only
from the top sand pick (red dash line in
Fig.
5.77a
). Note how the water sand data have a strong
clustering at a low angle to the vertical (the noise
ellipse described by Hendrickson (
1999
)). The water
gathers effectively means that, for a given horizon,
slightly different intercept and gradient fits will be
made at each gather. The effect is more pro-
nounced on the gradient compared to the inter-
cept and the two parameters are highly anti-
107