Geology Reference
In-Depth Information
Bandlimited
Impedance Trace
Zero phase
wavelet
Rc
Seismic Trace
AI
*
=
Figure 5.71
Schematic model showing relationship of seismic reflectivity and bandlimited impedance (after Kleyn,
1983
); with kind
permission from Springer Science+Business Media B.V.
Reflectivity
data are zero phase, and has therefore been widely
adopted as a first-pass approach to deriving imped-
ance from reflectivity data.
Combining the concepts of AVO projections
and coloured inversion has proved to be a powerful
methodology (e.g. Connolly,
2010
). Coloured inver-
sions can be generated from reflectivity projections
or can be applied to intercept and gradient prior to
projection.
Figure 5.75
shows amplitude maps
derived from coloured inversions generated at dif-
ferent angles across a deep-water Angola discovery
(Connolly et al.,
2002
). Fluid effects are optimised
at an angle of
Bandlimited Impedance
25° (note the down-dip shut-off
at the oil water contact), whereas the gradient
impedance display (
χ ¼
χ ¼
90°) is emphasising sand
continuity.
5.6 Seismic noise and AVO
Even with the best processed seismic data there is
always the issue of random noise to consider.
Random noise has a systematic effect on intercept
and gradient and this can have a number of impli-
cations for interpretation. The presence of
random noise in move-out corrected seismic
106
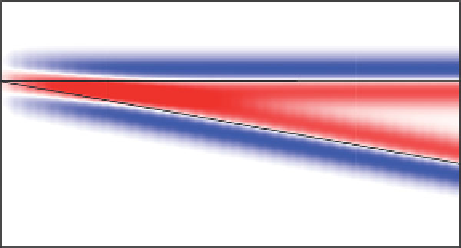
Figure 5.72
Tuning wedge model contrasting reflectivity and
bandlimited impedance.