Geology Reference
In-Depth Information
6000
9600
4500
6000
5000
9400
5000
4000
5000
9200
4000
3500
4000
4000
9000
3000
8800
3000
3000
3000
2500
2000
1500
8600
2000
2000
2000
8400
1000
0
8200
1000
1000
1000
500
8000
0
7800
-1000
0
*
Inc Angle = 40º
Inc Angle = 50º
Inc Angle = 90º
Time Structure
1.5
9600
10000
8000
6000
4000
2000
0
-2000
-4000
-6000
6100
6000
5900
5800
5700
5600
5500
5400
5300
5200
8000
9400
1
6000
9200
9000
0.5
4000
8800
2000
8600
0
8400
0
8200
-0.5
8000
-2000
7800
-1
1600 1400 1200
1600 1400 1200
Inline
1600 1400 1200
Inline
1600 1400 1200
Inline
Inline
Figure 5.56
AVO projections generated using Shuey's Equation, combining intercept and gradient maps with varying angle of incidence (θ)
(after Hendrickson,
1999
).
χ
=-55º or +305º
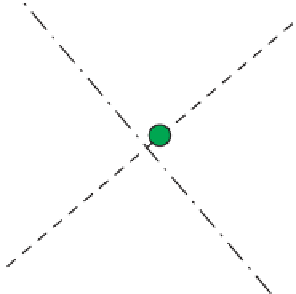
two sands with different porosity, both brine and gas
filled. A lithology optimized (fluid minimized) angle
can be generated by rotating the AVO crossplot axes
either by 55° in a clockwise (i.e. negative direction) or
anticlockwise by 305°. The resulting equations are
equivalent:
+G
-
R
0
cos 305
þ
G sin 305
R
¼
ð
5
:
12
Þ
R
0
cos 55
G sin 55
:
R
¼
-
+
R(0)
An example of AVO projections applied to log data
(in a Class I oil sand setting) is shown in
Fig. 5.58
.
The figure shows the log curves with a synthetic
gather and intercept and gradient traces. An AVO
crossplot is shown in
Fig. 5.58b
, with the blue and
red points representing wet sands plus shales and the
oil zone respectively. An important feature is that the
general reflectivity background (i.e. wet sands and
shales) has a trend from top left to bottom right (i.e.
decreasing amplitude with increasing angle). As
expected, top oil sand reflections fall to the left of
the general wet trend and oil water contact reflections
fall
+
34% porosity
29% porosity
-
Wet
Gas
96
Figure 5.57
AVO projection maximising porosity differences and
minimising the effect of fluid fill.
in the upper right quadrant. Drawing a line


