Geoscience Reference
In-Depth Information
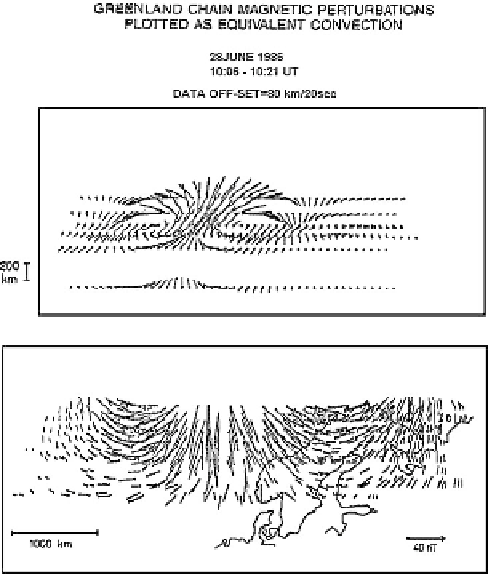
Fig. 3.9.
The equivalent current system constructed on the Greenland station chain
data shown in Fig. 3.8 (upper panel). The lower panel presents the result of the
spatial interpolation reproduced from Fig. 3.8 data [23]
part of Fig. 3.9. The lower panel presents the result of the spatial interpo-
lation of these data [23]. Mapping of the ground velocity of the vortices to
the magnetopause gives 220 km/s. This testifies to a possible connection of
the source with variations of solar wind parameters. Measurements of drift
velocities carried out in the ionosphere and results of satellite observations
showed the reliability of the scenario about traveling vortices being generated
by solar wind inhomogeneities ([53], [105], [41]).
Pc
3
,
4 Pulsations
Dayside
Pc
3
,
4 pulsation amplitudes are strongly localized in latitude. Simul-
taneous observations of pulsations demonstrated that the latitude of max-
imum amplitude depends on the wave period, and the phase of the
NS
-
magnetic component varies abruptly at the scale of the order of 100 km across
the latitudinal maximum [27]. The pulsations were observed at a meridional
chain of 5 stations in Great Britain located approximately along -140
◦
longi-
tude at distances of 120
−
170 km from one another for all the five observatories
Search WWH ::

Custom Search