Geoscience Reference
In-Depth Information
2
|b
(g)
|
1
|E
(g)
/Z
0
|
|b
(g)
|
0
20
Arg b
(g)
0
Arg b
(g)
Arg E
(g)
/Z
0
≈
−
20
−
40
0
0.01
0.02
0.03
0.04
0.05
k, km
−1
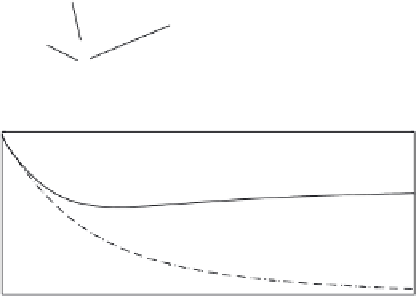
Fig. 11.6.
Dependence of the amplitude (upper panel) and phase (bottom panel) of
the ground magnetic
b
(
g
)
and electric
E
(
g
)
components on the horizontal wavenum-
x
y
ber
k
.
E
(
g
)
y
are normalized with the impedance
Z
0
. The model is the same as in
Fig. 11.5
•
Both electric and magnetic component maxima are shifted out of the field
line base. In the example given this shift is
≈
40 km
.
•
These maxima are shifted away from each other (
≈
20 km).
Amplitude dependencies are asymmetrical with respect to positions of
b
(
g
x
,
E
(
g
)
•
maxima.
y
Phase discontinuity of
b
(
g
)
and
E
(
g
)
•
through the resonance region is
x
y
180
◦
, while for
b
(
g
)
≈
270
◦
Taking into account the logarithmic term
in formula (8.15) reduces the magnitude of the phase discontinuity to
≈
it is
≈
z
100
◦
.
These features account for the special characteristics of the coecient
T
SA
(
k
) for transformation of an Alfven wave into a magnetic mode of a
ground field. Figure 11.6 illustrates the
T
SA
(
k
)-dependence. The labeling of
the curves is the same as in Fig. 11.5. The spatial spectrum of FLR is nonzero
only in the positive semi-axis and is concentrated in the
k
x
range from 0
to
10
−
1
km
−
1
. As a result, the spectrum at the ground contains harmonics
from0to10
−
2
km
−
1
.
In this region, the phase of
T
SA
(
k
) exhibits strong varia-
tions attributable primarily to the fact that the horizontal magnetic field scale
is comparable to the depth of the skin depth in the ground. It is convenient
to assume that the phase change
Φ
(
k
) in the indicated range of wavenumbers
is
∼
Φ
(
k
)
≈
(
x
+
x
0
)
k
+
Φ
0
,


Search WWH ::

Custom Search