Geoscience Reference
In-Depth Information
300
1
250
200
2
150
4
100
3
6
50
5
0
0
500
1000
1500
2000
x km
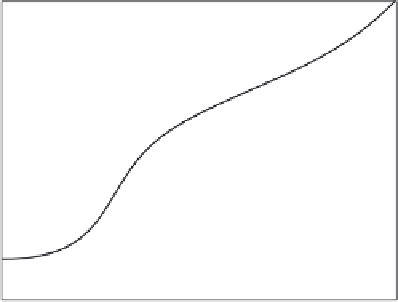
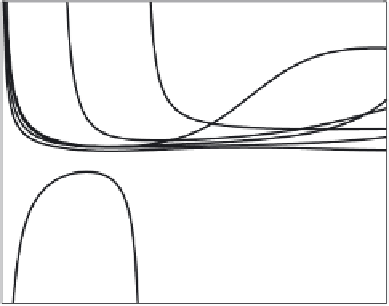
Fig. 8.4.
Plots of phases (in degrees) versus horizontal distance from the bell-beam
axis
a distance from the bell-beam for the ground and ionospheric conductivities
from Table 8.2. It is important to note that
ϕ
(
x
) has an extremum in the
case of the low conductive ground and night ionosphere. Correspondingly, in
the meridional distributions of the phase velocity
V
phase
(
x
) can appear regions
with the opposite sign of
V
phase
(
x
). Hence, when the ground is low conductive,
regions can appear with inverse phase velocity where the wave is seeming to
propagates towards the source.
2000
1500
6
2
1000
3
500
0
−500
5
1
4
−1000
−1500
−2000
0
500
1000
1500
2000
x km
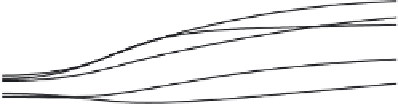
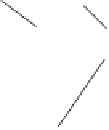
Fig. 8.5.
Plots of the apparent phase velocities in km/s versus horizontal distance
from the bell-beam axis


Search WWH ::

Custom Search