Biomedical Engineering Reference
In-Depth Information
As described above and as Fig.
3.3
implies, the extracel-
lular space is relatively positive, whereas the intracellular
space is negative. This is of major significance for the polar-
ity of the pacing pulse. To evoke an above-threshold stimulus
by pacing and depolarize the membranes, a negative pacing
pulse has to be applied. As a result, the extracellular space, in
which a pacing lead is placed, becomes more electronega-
tive. Thus, the difference in potentials on the membrane is
reduced, that is, it approaches a value of zero, which is above
the threshold level.
3.8
Origin of an Electrocardiogram
During conventional extracellular sensing, the depolarized
region is electronegative with respect to the polarized
regions. The excited myocardial fibers behave as a dipole
and create elementary electrical fields that are summarily
characterized by a vector of the cardiac electrical field.
Electric phenomena can be traced either by leads (epimyo-
cardial or endocardial) implanted in the heart or superficially
from the limbs and chest. When the junction of sensing sur-
face electrodes is located in a direction approximately paral-
lel to the longitudinal axis of the heart, an electrocardiogram
(ECG) has a characteristic appearance, as shown in Fig.
3.4
.
For the sake of good reproducibility, the placement of sur-
face electrodes is standardized to the well-established bipo-
lar limb leads (Einthoven), unipolar augmented limb leads
(Goldberg), and unipolar chest leads (Wilson). In pacing
practice, which is particularly aimed at distinguishing paced
and intrinsic cardiac activity, measuring the width of the
QRS complex, or both, this standardization is not adhered to
often. The electrical activity of the heart, defined by the sum
of action potentials in all cells, can, of course, be recorded
inside the heart. An intracardial recording of the electrical
activity is referred to as an electrogram. It is obtained through
implanted leads on the programmer screen.
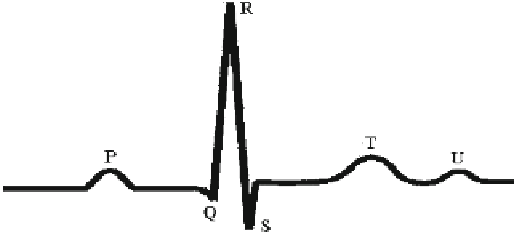
A normal cardiac cycle begins with a small, rounded, pos-
itive P wave. It lasts about 80 ms and represents depolariza-
tion of the atria. The direction of the instantaneous vector of
the electrical field is downward and to the left. It is followed
by a PQ segment determined by the isoelectric line, and it
also lasts about 80 ms. Next, the ventricular complex consist-
ing of QRS waves and a T wave follows. A negative Q wave
represents the onset of depolarization of the ventricular myo-
cardium in the septal region. The direction of the instanta-
neous vector of the electrical field is downward and to the
right. A prominent and positive R wave indicates propaga-
tion of an impulse over the walls of the ventricles; a negative
S wave represents activation of the ventricular myocardium
at the base of the left ventricle, and the instantaneous vector
of the electrical field points to the left. This segment lasts
3.7
Spread of Impulse
The ability to generate and spread an impulse is characteris-
tic of some cardiac fibers that comprise the heart's conduc-
tion system. In contrast to the working myocardial fibers,
they lack the ability to contract.
Impulses between cells are transmitted by local electric
currents determined by the gradients between depolarized
and polarized (de-excited) regions. An impulse is propagated
along the myocardial fibers over the whole heart. Cells are
connected to each other by intercalated discs with minimal
electric resistance. Any impulse with an above-threshold
intensity then spreads over the whole heart and produces
depolarization in all cells.
In a healthy heart, an impulse originates in the SA node
and is propagated by the working atrial myocardium. No
conduction pathways (such as those in the ventricles) are
morphologically apparent here; however, there are certain
preferred ways impulses can be spread. The AV node, which
slows the impulse to a propagation velocity of about 5 cm/s,
is the only conductive link between the atria and the ventri-
cles. The entirety of the ventricles is excited by an impulse
that is propagated to the Purkinje fibers by passing through
the interventricular septum, AV bundle of His, bundle
branches, and subsequent branching.
In relation to the conduction system, one needs to be
aware of the so-called cardiac automaticity gradient that can
be encountered while using the pacing method; it also has to
be taken into account in certain patients when, for example,
ventricular pacing is used. It refers to the fact that not only
the SA node, but each component of the above-described
conduction system, has the capacity to automatically and
independently generate impulses, although these impulses
have a lower rate. If the rate of production of spontaneous
impulses in the SA node is 60-80/min, then the production is
40-60/min in AV node impulses and only 20-40/min for
those generated in the ventricular conduction system. Thus,
under normal conditions, generation of impulses in the sinus
node predominates because it is fastest. Lower parts of the
conduction system are involved in impulse generation only
when there is a pathological loss of function of a superior
node or when a conduction disorder occurs.
Fig. 3.4
Surface ECG, basic form