Biomedical Engineering Reference
In-Depth Information
and PTB-Diagnostic ECG data (ptbdb) have been used. For feature extraction,
only the ptbdb data have been used.
2.4.1 QRS Detection
2.4.1.1 Processing of Differential ECG Data
Normally, the region of QRS is with highest slope (or, inter-sample difference) in a
typical ECG beat. A method of QRS detection is developed by processing of
differential ECG or D-ECG, which is generated by computing the successive
sample differences of the ECG samples. From an ECG data array x, the corre-
sponding D-ECG array y is generated as
y
ð
i
Þ¼
x
ð
i
þ
1
Þ
x
ð
i
Þ
ð
2
:
10
Þ
Since the maximum width of QRS region is nominally 96 ms, a window of
same width is slid along the D-ECG array to find out a probable QRS neighbor-
hood by use of some criteria. The objective is to capture an index near to the sharp
peak in order to reveal QRS region. At this index, the following criteria must
match the following:
1. Absolute value of sample will be greater than or equal to 50 % of maximum
sample magnitude;
2. Average slope, computed over ±3 samples around will be positive;
3. Average slope, computed over ±3 samples around at 30 points downside will
be negative;
4. Mean absolute slope will be greater than or equal to 30 % of maximum
absolute slope of the D-ECG array.
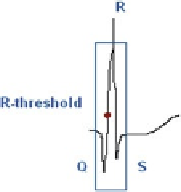
Matching all these criteria would locate a sample on the rising edge of an R
peak, named as 'R-threshold point' as shown in Fig.
2.5
. Then, from this
'R-threshold point,' next 50 upside samples are sorted in descending order of their
magnitude as well as index. The position of highest amplitude is provisionally
taken as the R peak. Its candidature is cross-verified by a slope sign reversal within
50 samples upside along the array from this point. For ECG records with QS
Fig. 2.5
R-threshold point
Search WWH ::

Custom Search