Biomedical Engineering Reference
In-Depth Information
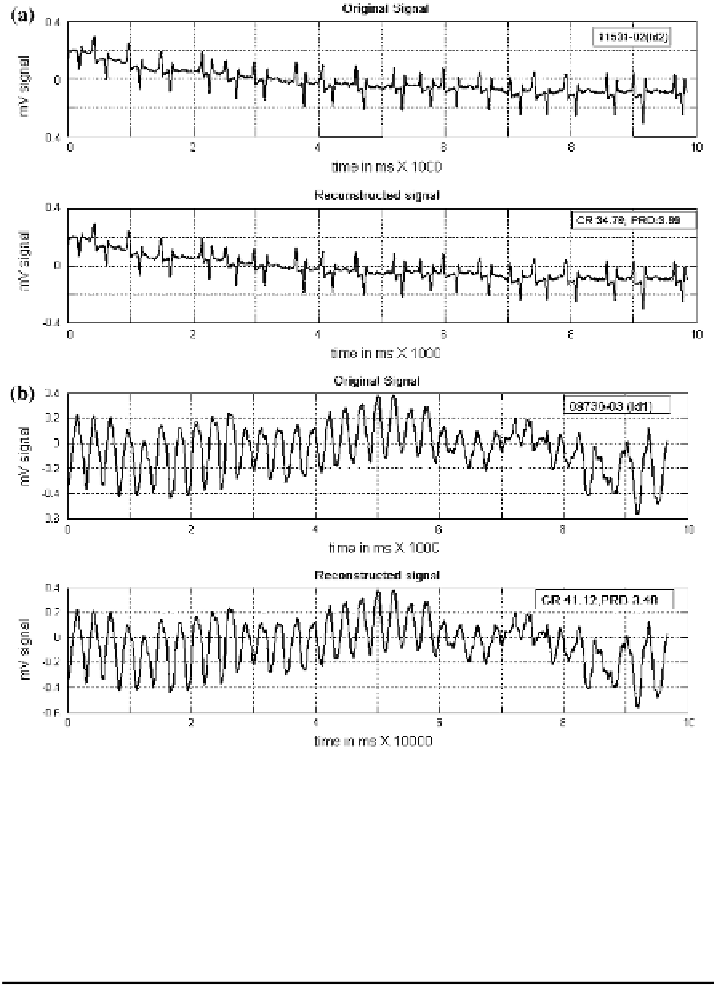
Fig. 5.8 Data plot before compression and after decompression using mit-db record (using
down-sampling) (a) c-db data; (b) mit-db data
Table 5.7
DDF parameter estimation for c-db
RR
i
QRS
dur
QT
int
P
width
0.202
3.72
2.08
1.31
P
ampl
S
ampl
T
ampl
R
ampl
0.92
2.2
3.81
1.92
(i.e., 1 in 255) and 0.78 % (i.e., 2 in 255) are used. The differences up to these
threshold levels are taken as zero. By this modification, the equipotential segments
generate more number of consecutive zero elements, P and T waves are not
significantly distorted, and QRS is undistorted. It is observed with threshold of


Search WWH ::

Custom Search