Biomedical Engineering Reference
In-Depth Information
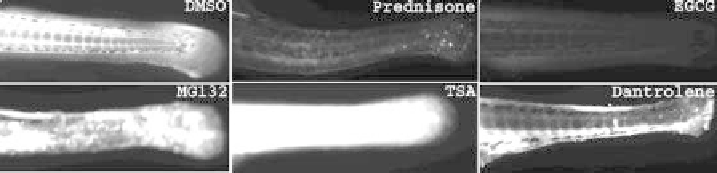
Figure 18.8
ROS staining in drug-treated MD zebrafish. Control and drug-treated 3dpf MD
zebrafish were stained with H
2
DCFDA; fluorescence staining in the tail region was examined. Prednisone
and EGCG treatment significantly reduced ROS-specific fluorescence intensity; TSA and dantrolene
treatment increased ROS-specific fluorescence intensity. MG132 treatment did not induce significant
changes in fluorescence intensity.
whereas MG132- and dantrolene-treated MD zebrafish exhibited staining intensity
similar to vehicle control (DMSO). TSA-treated zebrafish exhibited increased
staining intensity. Severe toxicity was observed after treatment with TSA, which
may have contributed to a high level of fluorescence. Our results after prednisone
treatment were consistent with reports that anti-inflammatory effects of some
glucocorticoids, including prednisone and dexamethasone, may be mediated by
suppressing ROS (Sanner et al., 2002).
Next, using image-based morphometric analysis, we quantified ROS-specific
fluorescence intensity in the tail region after drug treatment. To highlight the area of
interest, we applied a consistent threshold value (100) to each tail image. The
histogram value (hv) of the highlighted region was quantitated using Photoshop
software (Adobe, San Jose, CA); 8-10 animals were used for each condition. Signal
intensity for uninjected, KD control, and MD zebrafish was 16,192
9960,
18,067
59,988, respectively. Difference in ROS level for
uninjected and KD control zebrafish was insignificant (
P
6315, and 125,471
0.7314), indicating that
KD control did not increase ROS level in injected animals; however, the difference
between KD control and MD zebrafish (
P
¼
0.0018) indicated significant ROS
induction. 0.1% DMSO-treated MD zebrafish exhibited fluorescence intensity of
135,516
¼
86,715, and the difference between MD zebrafish was insignificant
(
P
0.7667), indicating that carrier solvent did not affect ROS level.
We then assessed effects of varying concentrations of prednisone, EGCG,
MG132, TSA, and dantrolene. In order to compare results fromdifferent experiments,
drug effects were normalized to percent of control (percent of control
¼
hv(drug)/
hv(DMSO control)). Dose response curves were then generated for each drug using
level of ROS as percent of control versus drug concentration (Fig. 18.9). Prednisone
and EGCG significantly decreased ROS staining (
P
¼
0.0004,
respectively), whereas MG132 and dantrolene did not cause significant effects
(
P
¼
0.0078 and
P
¼
0.7739, respectively); at high concentrations, TSA caused a
significant increase in ROS staining (
P
<
0.0001), possibly due to compound-
induced toxicity.
¼
0.0587 and
P
¼
Search WWH ::

Custom Search