Biomedical Engineering Reference
In-Depth Information
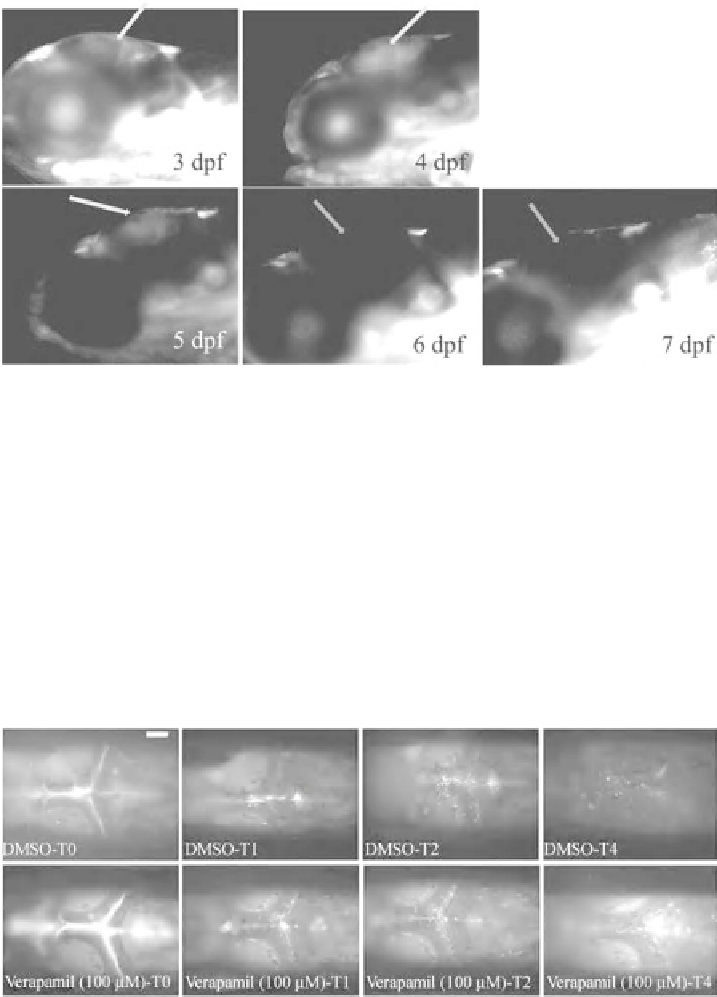
Figure 14.3
Determine optimal stage to assess Pgp efflux. Rhodamine 123 was injected into zebrafish
circulation at 3, 4, 5, 6, and 7dpf. (b) Fluorescence was detected in the brain of 3, 4, and 5dpf zebrafish
(yellow arrows) at 2 hpi, indicating that dye crossed BBB andwas retained in the brain region. However,
fluorescence signal was absent in the brain region of 6 and 7dpf zebrafish (blue arrows), indicating dye
efflux. White scale bar is 300 mm. (See the color version of this figure in Color Plates section.)
14.3.2 Assessment of Pgp Efflux
After establishing that Pgp was fully functioning by 7dpf, we next assessed Pgp efflux
kinetics. Since rhodamine 123 injected into the circulation was not retained in brain
tissue at 7dpf stage (Fig. 14.4), we attempted direct brain injection. However, due to
variable clearance of rhodamine 123 from the brain, we used an alternative fluorescent
Figure 14.4
Kinetics of rho-HRP efflux. Sevendpf zebrafish were soaked in either 0.1% DMSO or
verapamil for 1 h before injecting rho-HRP into the brain. Dorsal view ROI images were captured at
15min post injection (designated as T0) and at 1, 2, and 4 hpi, designated as T1, T2, and T4, respectively
(25
). By T4, minimal fluorescence signal was detected in 0.1% DMSO control animals. In contrast,
fluorescence remained high in verapamil-treated animals, indicating decreased Pgp-mediated rho-HRP
efflux. Anterior to the left; white scale bar is 100
m
m.
Search WWH ::

Custom Search