Biomedical Engineering Reference
In-Depth Information
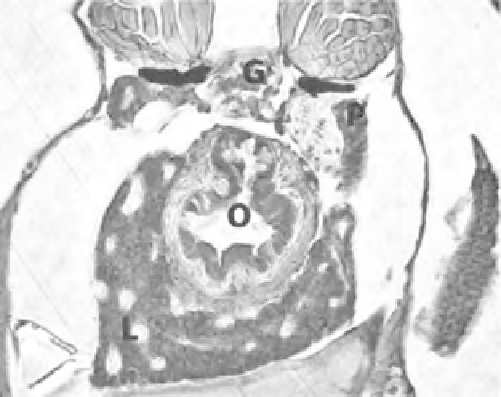
Figure 8.1
Transverse section of a wild-type Tu zebrafish larvae at 120hpf. Larva embedded in JB-4
resin, sectioned, and stained with Giemsa. O, esophagus; L, liver; G, glomerulus; P, pronephric duct. (See
the color version of this figure in Color Plates section.)
appear to surround the esophagus (Fig. 8.1). The organ is fairly globular in structure,
has a clearly recognizable periphery against the neighboring tissues, and is perfused
with circulating blood cells. When exposed to a hepatotoxicant, changes to liver
morphology can be evaluated using a method such as those described below by
Hill (2008b).
8.5.1 Phenotypic Screening Methods
Tuebingen zebrafish larvae are arrayed in 24-well culture plates containing fresh
0.3
stock: 58mM NaCl, 0.7mM KCl, 0.4mM MgSO
4
, 0.6mM Ca(NO
3
)
2
,5.0mM
HEPES, pH 7.1) and allowed to acclimate. Meanwhile stock solutions of test com-
pounds are produced for a six-point concentration range (3-1000
Danieau's solution (the supportive medium used to maintain the zebrafish; 1
M). Sixteen larvae
per concentration are statically treated with test compound alongside relevant controls
for 2 days from 72hpf, at 28.5
m
0.5
C in a humidity-controlled environment, and
checked for dead larvae after 24 h. At 120hpf (after a 48 h incubation), larvae are
anaesthetized inMS222 (tricaine) and screened for three specific phenotypic endpoints
of hepatotoxicity: liver abnormality (tissue degradation), changes in liver size (hepa-
tomegaly), and yolk retention (an endpoint of liver function, as yolk is utilized through
the liver and this is diminished if the liver is impaired).
8.5.2 Phenotypic Screening Validation
In order to assess the zebrafish hepatotoxicity model, Hill et al. (2008) selected a
variety of well-known liver toxicants, toxic compounds that did not cause adverse
Search WWH ::

Custom Search