Cryptography Reference
In-Depth Information
How? We simply run a counter over every character in the text and compare it to known samples of the
language. For the case of frequency analysis, monoalphabetic ciphers should preserve the
distribution
of the
frequencies, but will not preserve the matching of those relative frequencies to the appropriate letters. This is
how these ciphers are often broken: trying to match the appropriate characters of a certain frequency in the un-
derlying language to a similarly acting character in the ciphertext. However, not all ciphers preserve these kinds
of characteristics of the origin language in the ciphertext.
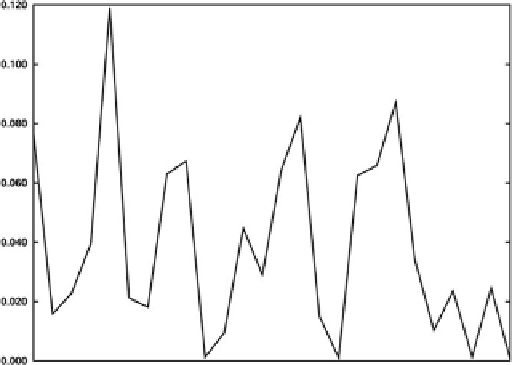
A distribution of English is shown in
Figure 1-1
,
which is derived from
The Complete Works of William
Shakespeare.
The graph shows the frequency of each character in the Latin alphabet (ignoring case) in
The
Complete Works of William Shakespeare
[3].
Figure 1-1
Frequency distribution table for Shakespeare's complete works [3]. The letters are shown left to
right,
A
through
Z
, with the
y
-value being the frequency of that character occurring in
The Complete Works of
William Shakespeare
[3].
Each language has a unique footprint, as certain letters are used more than others. Again, in
Figure 1-1
, we
can see a large peak corresponding to the letter E (as most people know, E is the most common letter in Eng-
lish). Similarly, there are large peaks in the graph around the letters
R
,
S
, and
T
.
For monoalphabetic substitution ciphers, the graph will be mixed around, but the frequencies will still be
there: We would still expect to see a large peak, which will probably be the ciphertext letter corresponding to
E.
The next highest occurring letters will probably correspond to other high-frequency letters in English.
Frequency distributions increase in utility the more ciphertext we get. Trying to analyze a five-letter word
will have practically no information for us to derive any information about frequencies, whereas several para-
graphs or more will give us more information to derive a frequency distribution.
Note, however, that just as frequency distributions are unique to languages, they can also be unique to par-
ticular samples of languages.
Figure 1-2
shows a frequency analysis of the Linux kernel source code that has a
different look to it, although it shares some similar characteristics.
Search WWH ::

Custom Search