Biomedical Engineering Reference
In-Depth Information
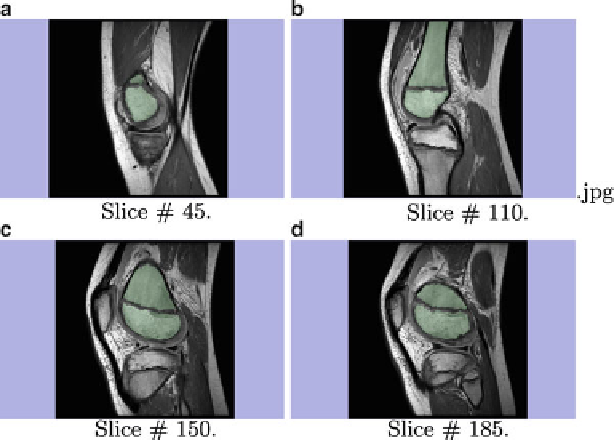
Fig. 5 This figure shows result achieved using the HSC Interactive Segmentor. By zooming in on
the images, it becomes noticeable that this algorithm attains accurate segmentation results even for
complex image regions (around the growth plate)
3.2 Comparison to Semi-Automatic Segmentation Methods
Recent work on semi-automatic segmentation consists primarily of methods based
either on
graphs
[
7
]or
active-contours
[
8
]. Often these methods are sensitive to
initialization and providing a good initial label volume is not simple. As seen in
Fig.
4
, the output of our algorithm converges to the ground truth; for our
comparisons, we initialize using the ground truth because this is the best case
scenario. The final result of these methods is worse than the initialization.
We present results using Bhattacharyya [
9
] and RSS [
10
] active contours and
graph cuts. In Fig.
6
, the top row of models are the segmentation results and the
bottom row are figures showing curvature of the corresponding model surface in the
top row. Bhattacharyya segmentation separates intensity distributions, but in our
case, background and foreground distributions are overlapping, which leads to the
undersegmentation in Fig.
6
a. RSS performs segmentation using robust statistics
like median and interquartile range, but these descriptors are insufficient as seen in
the oversegmentation of the organ in Fig.
6
c. Finally, in Fig.
6
d, it can be seen that
numerous small islands form far away from the initialization because graph cuts is
globally optimal and the largest errors are near boundaries, which are the most time
consuming for a human.