Biomedical Engineering Reference
In-Depth Information
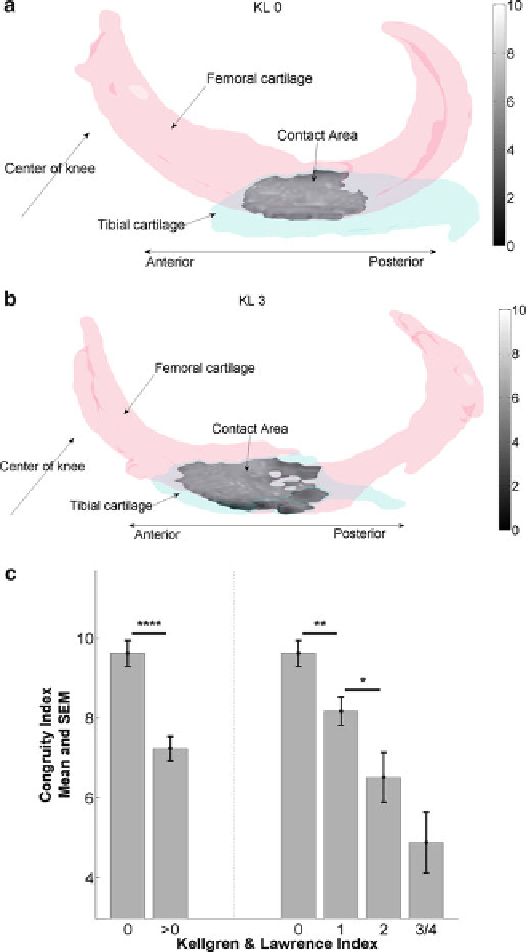
Fig. 2 (a) Congruity map shown for a healthy medial tibiofemoral joint (KL 0).
Bright color
indicates higher congruity and Dark indicates lower congruity shown over contact area.
(b) Congruity map shown for a medial tibiofemoral joint with advanced OA (KL 3). Colorbar is
given to compare the values for both the joints. (c) Cross-sectional separation of healthy (KL 0)
and knees with OA (KL
>
0) using congruity index. *
p <
0.05, **
p <
0.01, ****
p <
0.0001