Biomedical Engineering Reference
In-Depth Information
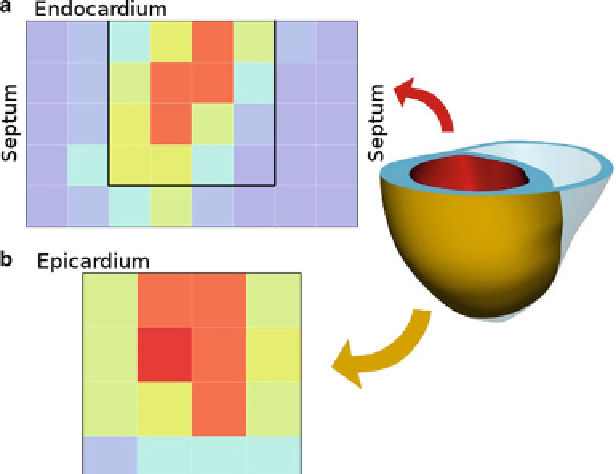
Fig. 1 Normalized percentage change in d
P
/d
t
max
for pacing sites on the (a) endocardium and (b)
epicardium, where
blue (gray)
to
red (dark gray)
correspond to the worst to best response. Pacing
sites are located in the middle of each tile. The
black
outline on the endocardium in panel (a) shows
the tiles that correspond to the LV epicardium tiles in panel (b)
The high computational cost of the simulations limits the number of variables
that can be easily manipulated. To maintain computational tractability, the model
simulated LV pacing only and the LV stimulation was applied at the same time as
intrinsic RV activation for all pacing locations. Specifically, simulations were used
to evaluate 56 regularly distributed pacing sites, 16 points on the epicardium, and
40 on the endocardium (see Fig.
1
). Fewer points were evaluated on the epicardium
than endocardium as no RV free wall pacing sites were evaluated.
2.4 Measures of Cardiac Function
The changes in volume averaged peak active stress, stretch in the fibre direction and
work rate are evaluated following CRT as additional metrics of cardiac mechanical
function. Maximizing average contraction over the whole heart provides a metric of
the regional contribution to ejection, maximizing the average stress provides a
measure of the regional contribution to systolic pressure and maximizing average
work rate provides a regional measure of cardiac output. Fibre stretch (
) was
l
defined by
p
2
E
ff
þ
l
¼
1
(2)
;