Biomedical Engineering Reference
In-Depth Information
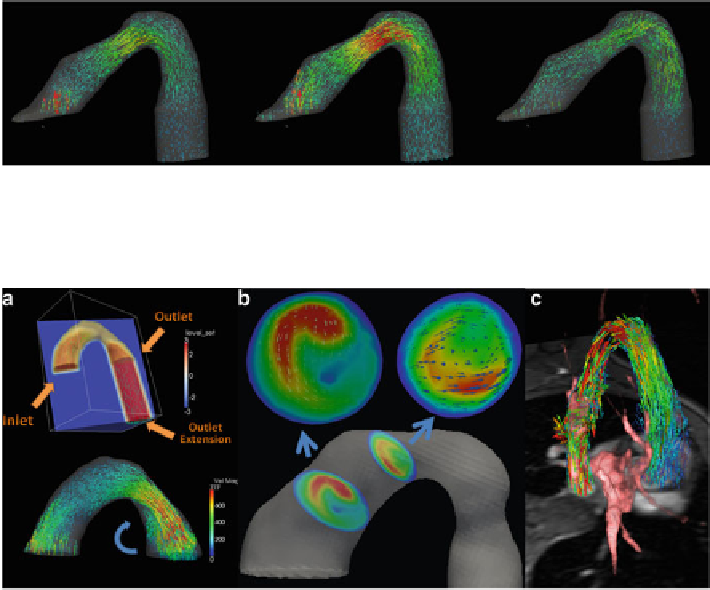
Fig. 2 Simulation sequence for systolic flow in aorta with valve replacement. Times 0.07, 0.11,
0.2 s
Fig. 3 (a) Our computational setup: the Lagrangian aortic mesh is embedded in an Eulerian
domain using a level set. Visible here are a cross-section of the domain, color-coded with the level
set values, and the embedded aortic mesh (the arch shape in the upper region) together with its
outlet extension (straight tubular shape in lower right region of the domain). The blood velocity
field during early systole, simulated using CFD, is also visualized as a vector field. Below,
coarctation with vortex formation.
(b) Enhanced helical
rotation due to bicuspid valve.
(c) Simulation results overlayed with anatomical images
semi-implicit treatment of the viscous terms used a tolerance of 10e-7 and usually
converged in less than 40 iterations.
The cardiac cycle simulated using our CFD method features generic flow
patterns like waveform delay between inlet and outlet, or increased velocities in
the aortic arch (Fig.
2
). Furthermore, our method also recovers patterns specific to
various pathologies, as outlined below. A first experiment used aortic data featuring
medium coarctation in the descending region. The vortex formation pattern specific
to coarctation was observed, and is shown in Fig.
3
a. A bicuspid heart experiment
Fig.
3
b produced the enhanced helical pattern observed in such hearts, due to the
blood jet that hits the aortic wall in the lower AAo.